
House Prices in H M S Collingwood
House prices in H M S Collingwood have an overall average of £269,224 over the last year.
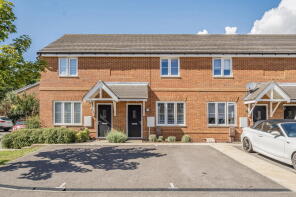
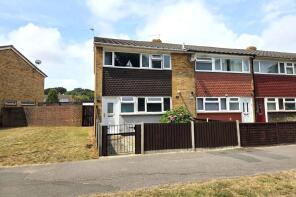
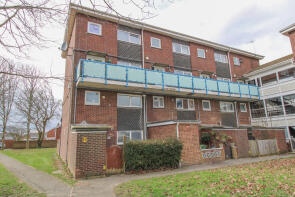
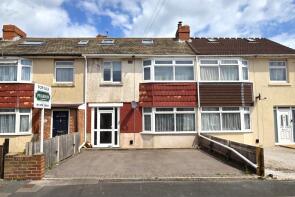
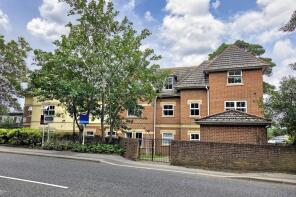
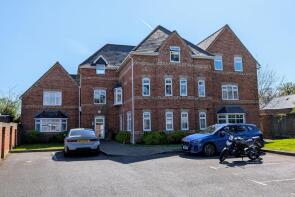
The majority of properties sold in H M S Collingwood during the last year were terraced properties, selling for an average price of £277,250. Flats sold for an average of £175,750, with semi-detached properties fetching £293,404.
Overall, the historical sold prices in H M S Collingwood over the last year were 12% down on the previous year and 10% down on the 2023 peak of £298,459.
Properties Sold
85, Blenheim House, Longfield Avenue, Fareham PO14 1BS
| Today | See what it's worth now |
| 13 Mar 2026 | £162,000 |
| 15 Jul 2011 | £110,000 |
No other historical records.
9, Dunstable Walk, Fareham PO14 1SE
| Today | See what it's worth now |
| 4 Mar 2026 | £332,500 |
No other historical records.
17, Coniston Walk, Fareham PO14 1LB
| Today | See what it's worth now |
| 27 Feb 2026 | £240,000 |
| 13 Sep 2019 | £210,000 |
19, Silver Birch Avenue, Fareham PO14 1SZ
| Today | See what it's worth now |
| 23 Feb 2026 | £457,500 |
| 11 Feb 2011 | £290,000 |
No other historical records.
Flat 8, 23, Normandy Road, Fareham PO14 1FL

| Today | See what it's worth now |
| 20 Feb 2026 | £160,000 |
| 27 Oct 2021 | £160,000 |
14, Helsby Close, Fareham PO14 1QJ
| Today | See what it's worth now |
| 16 Feb 2026 | £400,000 |
| 1 Oct 2015 | £240,000 |
16, Fort Fareham Road, Fareham PO14 1DG

| Today | See what it's worth now |
| 13 Feb 2026 | £220,000 |
| 20 Oct 2016 | £175,000 |
15, Mitre Court, Bishopsfield Road, Fareham PO14 1LN
| Today | See what it's worth now |
| 12 Feb 2026 | £94,000 |
| 21 Jun 2019 | £85,000 |
7, Cannock Walk, Fareham PO14 1JZ
| Today | See what it's worth now |
| 2 Feb 2026 | £142,000 |
No other historical records.
12, Mendips Road, Fareham PO14 1QD
| Today | See what it's worth now |
| 30 Jan 2026 | £270,000 |
No other historical records.
104, Longfield Avenue, Fareham PO14 1JT
| Today | See what it's worth now |
| 30 Jan 2026 | £220,000 |
| 25 Feb 2000 | £66,950 |
No other historical records.
16, Juno Close, Fareham PO14 1FN
| Today | See what it's worth now |
| 30 Jan 2026 | £285,000 |
| 19 Dec 2018 | £257,500 |
No other historical records.
5, Chamberlain Grove, Fareham PO14 1HH

| Today | See what it's worth now |
| 29 Jan 2026 | £288,000 |
| 19 Jun 2002 | £119,950 |
12, Broadacre Place, Fareham PO14 1GZ

| Today | See what it's worth now |
| 19 Dec 2025 | £200,000 |
| 16 Apr 2018 | £185,000 |
12, Crossfell Walk, Fareham PO14 1LQ
| Today | See what it's worth now |
| 18 Dec 2025 | £252,000 |
| 24 Sep 2021 | £254,000 |
8, Ramillies House, Bishopsfield Road, Fareham PO14 1QT
| Today | See what it's worth now |
| 16 Dec 2025 | £197,000 |
| 4 May 2018 | £166,000 |
68, Wallisdean Avenue, Fareham PO14 1HS
| Today | See what it's worth now |
| 15 Dec 2025 | £350,000 |
| 17 Oct 2022 | £265,000 |
No other historical records.
19, Jubilee Court, Fareham PO14 1DD
| Today | See what it's worth now |
| 12 Dec 2025 | £282,000 |
| 30 Jan 2017 | £223,000 |
39, Crossfell Walk, Fareham PO14 1LH
| Today | See what it's worth now |
| 10 Dec 2025 | £267,000 |
| 6 Aug 2024 | £263,000 |
12, Brecon Close, Fareham PO14 1ST
| Today | See what it's worth now |
| 3 Dec 2025 | £365,000 |
| 10 Apr 2017 | £315,000 |
5, Willow Tree Gardens, Fareham PO14 1PU
| Today | See what it's worth now |
| 17 Nov 2025 | £314,000 |
| 15 Sep 2009 | £217,000 |
11, Highfield Avenue, Fareham PO14 1JA
| Today | See what it's worth now |
| 14 Nov 2025 | £310,000 |
| 31 Mar 2000 | £72,000 |
No other historical records.
18, 39 York House, The Avenue, Fareham PO14 1PN
| Today | See what it's worth now |
| 13 Nov 2025 | £185,000 |
| 11 Mar 2005 | £225,000 |
No other historical records.
Source Acknowledgement: © Crown copyright. England and Wales house price data is publicly available information produced by the HM Land Registry.This material was last updated on 15 May 2026. It covers the period from 1 January 1995 to 31 March 2026 and contains property transactions which have been registered during that period. Contains HM Land Registry data © Crown copyright and database right 2026. This data is licensed under the Open Government Licence v3.0.
Disclaimer: Rightmove.co.uk provides this HM Land Registry data "as is". The burden for fitness of the data relies completely with the user and is provided for informational purposes only. No warranty, express or implied, is given relating to the accuracy of content of the HM Land Registry data and Rightmove does not accept any liability for error or omission. If you have found an error with the data or need further information please contact HM Land Registry.
Permitted Use: Viewers of this Information are granted permission to access this Crown copyright material and to download it onto electronic, magnetic, optical or similar storage media provided that such activities are for private research, study or in-house use only. Any other use of the material requires the formal written permission of Land Registry which can be requested from us, and is subject to an additional licence and associated charge.
Rightmove takes no liability for your use of, or reliance on, Rightmove's Instant Valuation due to the limitations of our tracking tool listed here. Use of this tool is taken entirely at your own risk. All rights reserved.