
House Prices in Harcombe Bottom
House prices in Harcombe Bottom have an overall average of £520,941 over the last year.
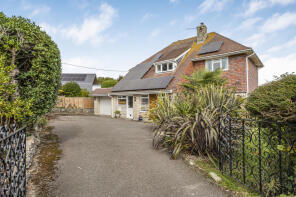
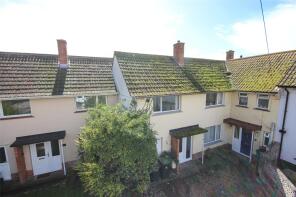
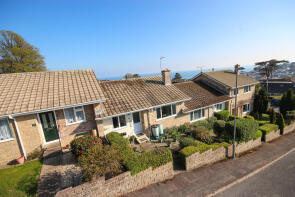
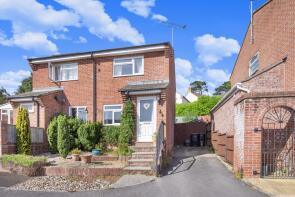
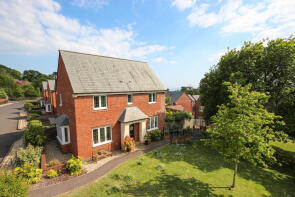
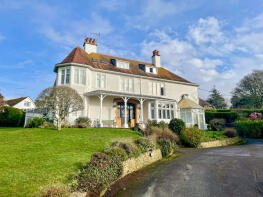
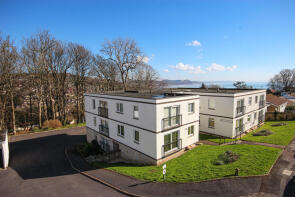
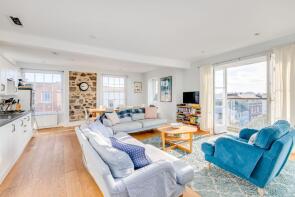
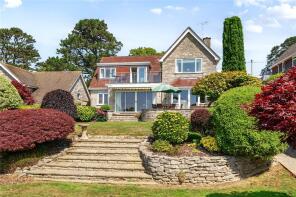
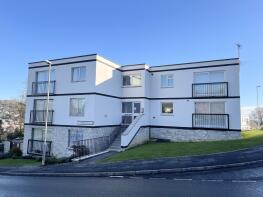
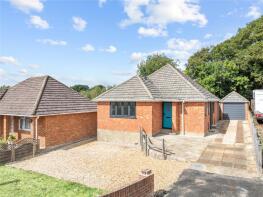
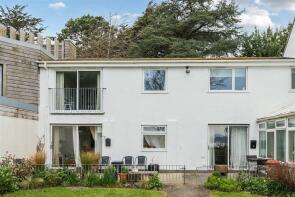
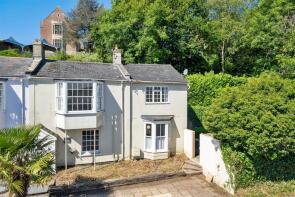
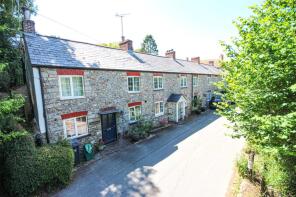
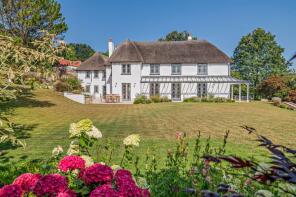
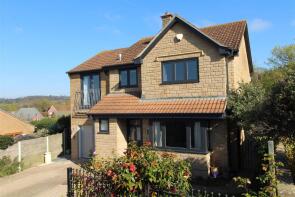
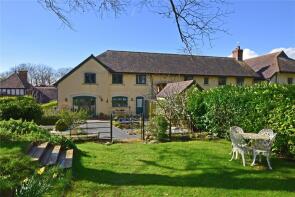
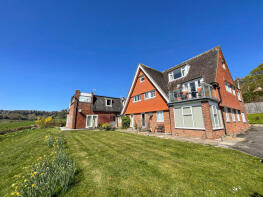
The majority of properties sold in Harcombe Bottom during the last year were detached properties, selling for an average price of £722,263. Flats sold for an average of £304,773, with terraced properties fetching £376,222.
Overall, the historical sold prices in Harcombe Bottom over the last year were 4% down on the previous year and similar to the 2023 peak of £519,891.
Properties Sold
L Horizon, Upper Westhill Road, Lyme Regis DT7 3ER
| Today | See what it's worth now |
| 24 Apr 2026 | £758,795 |
| 5 Jul 2004 | £378,000 |
58, Anning Road, Lyme Regis DT7 3EB
| Today | See what it's worth now |
| 9 Apr 2026 | £250,000 |
No other historical records.
59, Fairfield Park, Lyme Regis DT7 3DS
| Today | See what it's worth now |
| 20 Mar 2026 | £277,500 |
| 4 Aug 2009 | £198,000 |
50, Queens Walk, Lyme Regis DT7 3BH
| Today | See what it's worth now |
| 19 Mar 2026 | £240,000 |
| 12 Feb 2016 | £218,000 |
No other historical records.
2, Oak View, Lyme Regis DT7 3FA
| Today | See what it's worth now |
| 17 Mar 2026 | £510,000 |
| 31 Jan 2018 | £470,000 |
No other historical records.
Flat 1, Glen Andred, Colway Lane, Lyme Regis DT7 3HE
| Today | See what it's worth now |
| 11 Mar 2026 | £295,000 |
| 11 May 2012 | £180,000 |
No other historical records.
Flat 4, Charmouth House, Portland Court, Lyme Regis DT7 3NN
| Today | See what it's worth now |
| 6 Mar 2026 | £160,000 |
No other historical records.
Flat 3, 26, Broad Street, Lyme Regis DT7 3QE
| Today | See what it's worth now |
| 3 Mar 2026 | £435,000 |
| 16 Jul 2010 | £275,000 |
No other historical records.
The Ledges, Timber Hill, Lyme Regis DT7 3HQ
| Today | See what it's worth now |
| 27 Feb 2026 | £950,000 |
| 27 Jun 2002 | £370,000 |
11, Coombe Street, Lyme Regis DT7 3PR
| Today | See what it's worth now |
| 23 Feb 2026 | £450,000 |
| 6 May 2020 | £203,000 |
No other historical records.
2, Chideock Court, Clappentail Lane, Lyme Regis DT7 3NW
| Today | See what it's worth now |
| 23 Feb 2026 | £92,500 |
| 1 Mar 2024 | £108,000 |
Jordan Cottage, Mill Green, Lyme Regis DT7 3AQ
| Today | See what it's worth now |
| 18 Feb 2026 | £380,000 |
| 13 Sep 2001 | £128,000 |
No other historical records.
20, Talbot Road, Lyme Regis DT7 3BA
| Today | See what it's worth now |
| 18 Feb 2026 | £420,000 |
| 26 Mar 2015 | £247,500 |
No other historical records.
Tolcarne, Whalley Lane, Uplyme DT7 3UR
| Today | See what it's worth now |
| 10 Feb 2026 | £442,500 |
No other historical records.
20, Haye Close, Lyme Regis DT7 3NJ
| Today | See what it's worth now |
| 5 Feb 2026 | £375,000 |
No other historical records.
6, Talbot Road, Lyme Regis DT7 3BA
| Today | See what it's worth now |
| 6 Jan 2026 | £340,000 |
| 25 Oct 2007 | £320,000 |
No other historical records.
Flat 10, Farnham House, Stile Lane, Lyme Regis DT7 3JD
| Today | See what it's worth now |
| 18 Dec 2025 | £350,000 |
| 26 Mar 2002 | £139,950 |
No other historical records.
2, Spring Cottages, Uplyme Road, Lyme Regis DT7 3LS
| Today | See what it's worth now |
| 16 Dec 2025 | £290,000 |
| 2 Feb 2007 | £288,000 |
Valley Cottage, Venlake, Lyme Regis DT7 3SE
| Today | See what it's worth now |
| 28 Nov 2025 | £319,000 |
| 11 Oct 2013 | £210,000 |
15b, Broad Street, Lyme Regis DT7 3QE

| Today | See what it's worth now |
| 21 Nov 2025 | £320,000 |
| 19 May 2004 | £180,000 |
No other historical records.
1, Summerhill House, Charmouth Road, Lyme Regis DT7 3DW
| Today | See what it's worth now |
| 14 Nov 2025 | £350,000 |
| 14 Aug 2015 | £290,000 |
Colway House, Uplyme Road, Lyme Regis DT7 3LS
| Today | See what it's worth now |
| 3 Nov 2025 | £2,725,000 |
| 3 Jun 2021 | £1,587,500 |
9, Pine Ridge, Lyme Regis DT7 3HP
| Today | See what it's worth now |
| 29 Oct 2025 | £538,500 |
| 9 Feb 2022 | £510,000 |
Source Acknowledgement: © Crown copyright. England and Wales house price data is publicly available information produced by the HM Land Registry.This material was last updated on 9 July 2026. It covers the period from 1 January 1995 to 30 April 2026 and contains property transactions which have been registered during that period. Contains HM Land Registry data © Crown copyright and database right 2026. This data is licensed under the Open Government Licence v3.0.
Disclaimer: Rightmove.co.uk provides this HM Land Registry data "as is". The burden for fitness of the data relies completely with the user and is provided for informational purposes only. No warranty, express or implied, is given relating to the accuracy of content of the HM Land Registry data and Rightmove does not accept any liability for error or omission. If you have found an error with the data or need further information please contact HM Land Registry.
Permitted Use: Viewers of this Information are granted permission to access this Crown copyright material and to download it onto electronic, magnetic, optical or similar storage media provided that such activities are for private research, study or in-house use only. Any other use of the material requires the formal written permission of Land Registry which can be requested from us, and is subject to an additional licence and associated charge.
Rightmove takes no liability for your use of, or reliance on, Rightmove's Instant Valuation due to the limitations of our tracking tool listed here. Use of this tool is taken entirely at your own risk. All rights reserved.