
House Prices in Haverigg
House prices in Haverigg have an overall average of £173,375 over the last year.
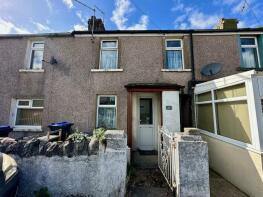
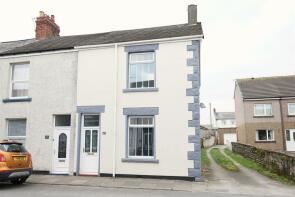
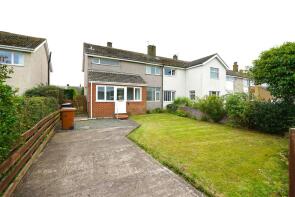
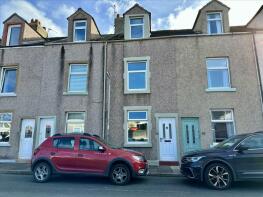
The majority of properties sold in Haverigg during the last year were terraced properties, selling for an average price of £168,400. Semi-detached properties sold for an average of £122,500, with detached properties fetching £300,000.
Overall, the historical sold prices in Haverigg over the last year were 4% up on the previous year and 10% up on the 2021 peak of £157,400.
Properties Sold
17, Bank Head, Millom LA18 4LZ
| Today | See what it's worth now |
| 21 Nov 2025 | £155,000 |
| 23 May 1996 | £8,750 |
No other historical records.
8, Pepper Hall Walk, Haverigg LA18 4HT
| Today | See what it's worth now |
| 18 Nov 2025 | £120,000 |
No other historical records.
32, The Front, Millom LA18 4EP
| Today | See what it's worth now |
| 24 Sep 2025 | £143,000 |
| 15 Dec 2008 | £115,000 |
No other historical records.
14, Bank End, Millom LA18 4ES
| Today | See what it's worth now |
| 19 Sep 2025 | £80,000 |
| 18 May 2012 | £76,000 |
No other historical records.
33, Silverdale Street, Millom LA18 4EU
| Today | See what it's worth now |
| 21 Aug 2025 | £114,000 |
| 13 Jan 2014 | £70,000 |
Midwicket, Willowside Park, Haverigg LA18 4PT
| Today | See what it's worth now |
| 25 Jul 2025 | £300,000 |
No other historical records.
1, Waingate Bridge, Millom LA18 4NF
| Today | See what it's worth now |
| 11 Jul 2025 | £385,000 |
| 10 May 2002 | £45,500 |
1, Atkinson Street, Haverigg LA18 4HA
| Today | See what it's worth now |
| 4 Jul 2025 | £90,000 |
No other historical records.
20, Bank Head, Millom LA18 4LZ
| Today | See what it's worth now |
| 26 Mar 2025 | £240,000 |
| 7 Jun 2010 | £60,000 |
No other historical records.
5, Richmond Gardens, Millom LA18 4HU
| Today | See what it's worth now |
| 24 Mar 2025 | £215,000 |
| 6 Oct 2000 | £19,000 |
No other historical records.
13, Bankfield Road, Millom LA18 4ET
| Today | See what it's worth now |
| 27 Feb 2025 | £138,000 |
| 29 Aug 2013 | £72,000 |
Kintail Cottage, St Lukes Road, Millom LA18 4HB
| Today | See what it's worth now |
| 13 Feb 2025 | £415,000 |
| 28 Sep 2012 | £249,999 |
27, Silverdale Street, Haverigg LA18 4EU
| Today | See what it's worth now |
| 7 Feb 2025 | £65,000 |
No other historical records.
21, Silverdale Street, Millom LA18 4EU

| Today | See what it's worth now |
| 6 Feb 2025 | £119,000 |
| 21 Sep 2020 | £93,000 |
67, Main Street, Millom LA18 4EY
| Today | See what it's worth now |
| 29 Jan 2025 | £170,000 |
| 31 Jul 2006 | £124,950 |
6, Bank Head, Millom LA18 4LZ
| Today | See what it's worth now |
| 13 Dec 2024 | £169,000 |
| 12 Jul 2012 | £123,000 |
25, Bank Head, Millom LA18 4LZ

| Today | See what it's worth now |
| 5 Dec 2024 | £215,000 |
| 27 Mar 2014 | £125,000 |
3, Atkinson Street, Millom LA18 4HA
| Today | See what it's worth now |
| 5 Dec 2024 | £140,000 |
| 7 Dec 2007 | £90,000 |
No other historical records.
18, Main Street, Millom LA18 4EX
| Today | See what it's worth now |
| 1 Nov 2024 | £134,000 |
| 29 Feb 2008 | £115,000 |
36, Town Head, Millom LA18 4HF

| Today | See what it's worth now |
| 18 Oct 2024 | £215,000 |
| 22 Dec 2016 | £135,000 |
No other historical records.
94, Main Street, Millom LA18 4EY
| Today | See what it's worth now |
| 16 Oct 2024 | £159,950 |
| 12 Apr 2017 | £68,000 |
No other historical records.
31, Poolside, Millom LA18 4HN
| Today | See what it's worth now |
| 16 Oct 2024 | £118,000 |
| 9 May 2005 | £79,000 |
16, Bankfield Road, Millom LA18 4ET

| Today | See what it's worth now |
| 11 Oct 2024 | £110,000 |
| 12 Sep 2018 | £100,000 |
No other historical records.

Source Acknowledgement: © Crown copyright. England and Wales house price data is publicly available information produced by the HM Land Registry.This material was last updated on 9 July 2026. It covers the period from 1 January 1995 to 30 April 2026 and contains property transactions which have been registered during that period. Contains HM Land Registry data © Crown copyright and database right 2026. This data is licensed under the Open Government Licence v3.0.
Disclaimer: Rightmove.co.uk provides this HM Land Registry data "as is". The burden for fitness of the data relies completely with the user and is provided for informational purposes only. No warranty, express or implied, is given relating to the accuracy of content of the HM Land Registry data and Rightmove does not accept any liability for error or omission. If you have found an error with the data or need further information please contact HM Land Registry.
Permitted Use: Viewers of this Information are granted permission to access this Crown copyright material and to download it onto electronic, magnetic, optical or similar storage media provided that such activities are for private research, study or in-house use only. Any other use of the material requires the formal written permission of Land Registry which can be requested from us, and is subject to an additional licence and associated charge.
Rightmove takes no liability for your use of, or reliance on, Rightmove's Instant Valuation due to the limitations of our tracking tool listed here. Use of this tool is taken entirely at your own risk. All rights reserved.