
House Prices in Headingley
House prices in Headingley have an overall average of £286,830 over the last year.
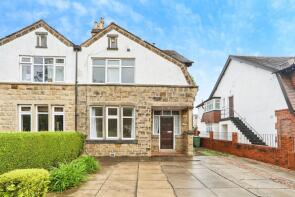
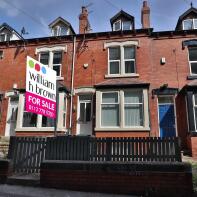
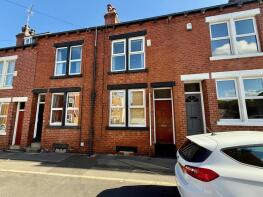
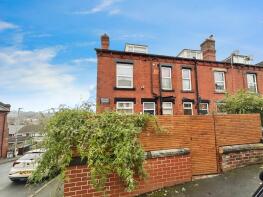
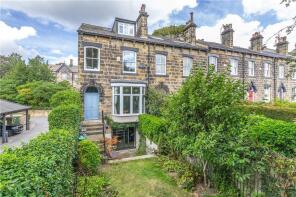
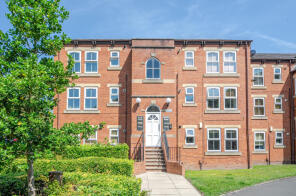
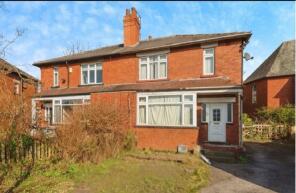
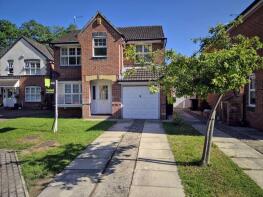
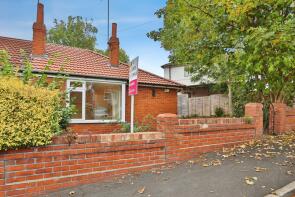
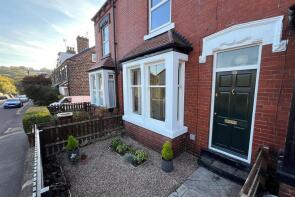
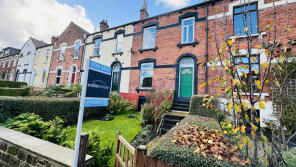
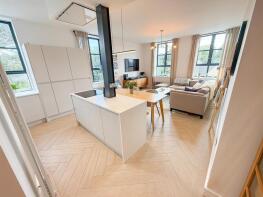
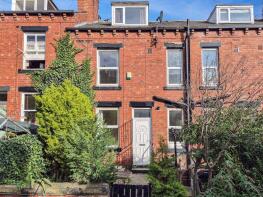
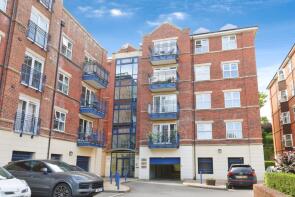
The majority of properties sold in Headingley during the last year were flats, selling for an average price of £188,327. Terraced properties sold for an average of £294,639, with semi-detached properties fetching £372,758.
Overall, the historical sold prices in Headingley over the last year were 2% down on the previous year and 2% up on the 2023 peak of £281,055.
Properties Sold
3, Woodbridge Gardens, Headingley, Leeds LS6 3LW

| Today | See what it's worth now |
| 24 Apr 2026 | £207,000 |
| 11 Feb 2008 | £138,500 |
30, St Chads Avenue, Headingley, Leeds LS6 3QF
| Today | See what it's worth now |
| 24 Apr 2026 | £475,000 |
| 18 Aug 2001 | £168,000 |
36, Langdale Terrace, Headingley, Leeds LS6 3DY
| Today | See what it's worth now |
| 23 Apr 2026 | £265,000 |
| 14 Apr 2014 | £156,500 |
No other historical records.
17, Orchard Court, St Chads Road, Headingley, Leeds LS16 5QS
| Today | See what it's worth now |
| 17 Apr 2026 | £65,000 |
| 10 Feb 2015 | £67,500 |
15, Monk Bridge Street, Meanwood, Leeds LS6 4HL
| Today | See what it's worth now |
| 16 Apr 2026 | £275,000 |
| 25 Oct 1999 | £58,500 |
52, Highbury Terrace, Headingley, Leeds LS6 4ET
| Today | See what it's worth now |
| 15 Apr 2026 | £250,000 |
| 12 Aug 2024 | £240,000 |
65, Stone Mill Court, Meanwood, Leeds LS6 4RQ

| Today | See what it's worth now |
| 15 Apr 2026 | £240,000 |
| 12 Apr 1999 | £67,000 |
No other historical records.
8, Albert Grove, Headingley, Leeds LS6 4DA
| Today | See what it's worth now |
| 8 Apr 2026 | £725,000 |
| 16 Dec 2016 | £500,000 |
11, Bridgewater Court, Meanwood, Leeds LS6 4AQ
| Today | See what it's worth now |
| 2 Apr 2026 | £160,000 |
| 5 Feb 2021 | £153,000 |
6, Headingley Crescent, Headingley, Leeds LS6 3EH
| Today | See what it's worth now |
| 2 Apr 2026 | £210,000 |
| 9 Aug 2001 | £119,000 |
No other historical records.
6, Pickard Bank, Meanwood, Leeds LS6 2SJ
| Today | See what it's worth now |
| 1 Apr 2026 | £365,000 |
| 24 Nov 2000 | £116,995 |
No other historical records.
2, Monk Bridge Mount, Meanwood, Leeds LS6 4HT
| Today | See what it's worth now |
| 27 Mar 2026 | £249,000 |
| 4 Sep 1998 | £47,000 |
88, Bentley Lane, Meanwood, Leeds LS6 4AJ
| Today | See what it's worth now |
| 26 Mar 2026 | £310,000 |
| 15 Dec 2023 | £236,500 |
9, Spring Hill Terrace, Monk Bridge Road, Meanwood, Leeds LS6 4EY
| Today | See what it's worth now |
| 20 Mar 2026 | £330,000 |
No other historical records.
1, Sycamore Close, Woodhouse, Leeds LS6 2HE
| Today | See what it's worth now |
| 20 Mar 2026 | £235,000 |
| 18 Dec 2019 | £156,000 |
55, Boothroyd Drive, Meanwood, Leeds LS6 2SL
| Today | See what it's worth now |
| 20 Mar 2026 | £430,000 |
| 17 Sep 2019 | £292,000 |
15, Bridgewater Court, Meanwood, Leeds LS6 4AQ
| Today | See what it's worth now |
| 20 Mar 2026 | £165,000 |
| 29 Jun 2021 | £159,950 |
No other historical records.
Flat 3, Burton Court, Burton Crescent, Headingley, Leeds LS6 4DN
| Today | See what it's worth now |
| 19 Mar 2026 | £240,000 |
| 16 Jan 2015 | £145,000 |
No other historical records.
32, Stone Mill Court, Meanwood, Leeds LS6 4RQ
| Today | See what it's worth now |
| 17 Mar 2026 | £197,500 |
| 16 Jun 2023 | £175,000 |
7, Abbey Gorse, Kirkstall, Leeds LS5 3DD
| Today | See what it's worth now |
| 16 Mar 2026 | £370,000 |
No other historical records.
65, Kirkstall Lane, Kirkstall, Leeds LS5 3JZ
| Today | See what it's worth now |
| 13 Mar 2026 | £135,125 |
| 2 Dec 2016 | £97,500 |
6, Abbey Court, Morris Lane, Kirkstall, Leeds LS5 3JD
| Today | See what it's worth now |
| 13 Mar 2026 | £167,000 |
| 8 May 2002 | £70,000 |
No other historical records.
26, Stone Mill Court, Meanwood, Leeds LS6 4RQ
| Today | See what it's worth now |
| 13 Mar 2026 | £226,000 |
| 19 Aug 2019 | £160,000 |
Source Acknowledgement: © Crown copyright. England and Wales house price data is publicly available information produced by the HM Land Registry.This material was last updated on 9 July 2026. It covers the period from 1 January 1995 to 30 April 2026 and contains property transactions which have been registered during that period. Contains HM Land Registry data © Crown copyright and database right 2026. This data is licensed under the Open Government Licence v3.0.
Disclaimer: Rightmove.co.uk provides this HM Land Registry data "as is". The burden for fitness of the data relies completely with the user and is provided for informational purposes only. No warranty, express or implied, is given relating to the accuracy of content of the HM Land Registry data and Rightmove does not accept any liability for error or omission. If you have found an error with the data or need further information please contact HM Land Registry.
Permitted Use: Viewers of this Information are granted permission to access this Crown copyright material and to download it onto electronic, magnetic, optical or similar storage media provided that such activities are for private research, study or in-house use only. Any other use of the material requires the formal written permission of Land Registry which can be requested from us, and is subject to an additional licence and associated charge.
Rightmove takes no liability for your use of, or reliance on, Rightmove's Instant Valuation due to the limitations of our tracking tool listed here. Use of this tool is taken entirely at your own risk. All rights reserved.