
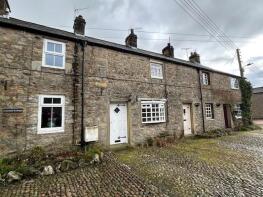
House Prices in Hellifield
House prices in Hellifield have an overall average of £238,150 over the last year.
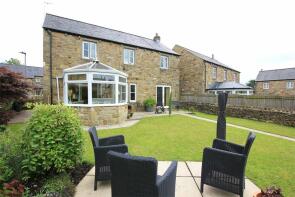
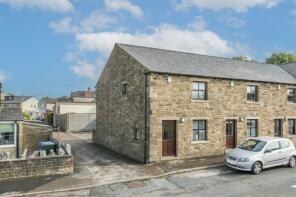
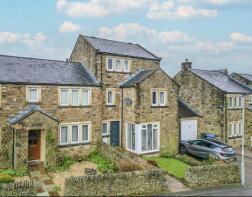
The majority of properties sold in Hellifield during the last year were terraced properties, selling for an average price of £213,100. Detached properties sold for an average of £347,000, with semi-detached properties fetching £137,500.
Overall, the historical sold prices in Hellifield over the last year were 10% down on the previous year and 33% down on the 2022 peak of £354,619.
Properties Sold
12, Main Road, Hellifield BD23 4ES
| Today | See what it's worth now |
| 31 Mar 2026 | £167,500 |
| 6 Jul 2001 | £61,000 |
No other historical records.
28, Newton Way, Hellifield, Skipton BD23 4NY

| Today | See what it's worth now |
| 27 Mar 2026 | £375,000 |
| 11 Dec 2013 | £260,000 |
5, Drovers Walk, Hellifield, Skipton BD23 4DW
| Today | See what it's worth now |
| 19 Dec 2025 | £326,000 |
| 14 Apr 2000 | £108,500 |
No other historical records.
8, Hawthorn Close, Hellifield, Skipton BD23 4JS
| Today | See what it's worth now |
| 15 Dec 2025 | £247,500 |
| 20 Jun 2003 | £127,950 |
7, Haw Grove, Hellifield, Skipton BD23 4JA

| Today | See what it's worth now |
| 21 Nov 2025 | £180,000 |
| 31 Oct 2005 | £125,500 |
2, St Aidans Court, Gisburn Road, Hellifield, Skipton BD23 4BQ
| Today | See what it's worth now |
| 20 Nov 2025 | £272,500 |
| 28 Jul 2017 | £214,950 |
No other historical records.
3, Gisburn Road, Hellifield, Skipton BD23 4LA
| Today | See what it's worth now |
| 3 Oct 2025 | £165,000 |
| 12 May 2006 | £136,000 |
2, Aspinall Rise, Hellifield, Skipton BD23 4JT
| Today | See what it's worth now |
| 1 Oct 2025 | £340,000 |
| 22 Jul 2011 | £250,000 |
2, Asperlands, Kendal Road, Hellifield, Skipton BD23 4HE
| Today | See what it's worth now |
| 12 Sep 2025 | £110,000 |
| 8 Jul 2011 | £100,000 |
12, Thornview Road, Hellifield, Skipton BD23 4JJ
| Today | See what it's worth now |
| 18 Jul 2025 | £198,000 |
| 29 Nov 1996 | £32,000 |
No other historical records.
11, Brook Street, Hellifield, Skipton BD23 4EX

| Today | See what it's worth now |
| 23 May 2025 | £169,000 |
| 3 Apr 2017 | £124,000 |
16, Park Place, Hellifield BD23 4HB

| Today | See what it's worth now |
| 17 Apr 2025 | £327,000 |
No other historical records.
12, Thorndale Street, Hellifield, Skipton BD23 4JE
| Today | See what it's worth now |
| 17 Apr 2025 | £175,000 |
| 7 Sep 2012 | £130,000 |
14, Thorndale Street, Hellifield, Skipton BD23 4JE
| Today | See what it's worth now |
| 3 Apr 2025 | £150,000 |
| 17 Apr 2014 | £122,000 |
1, Haw Grove, Hellifield, Skipton BD23 4JA

| Today | See what it's worth now |
| 31 Mar 2025 | £193,000 |
| 17 Aug 2010 | £155,000 |
2, Park Place, Hellifield, Skipton BD23 4HB
| Today | See what it's worth now |
| 27 Feb 2025 | £295,000 |
| 17 Dec 2012 | £125,000 |
Rose Cottage Barn, Gisburn Road, Hellifield BD23 4LA
| Today | See what it's worth now |
| 26 Feb 2025 | £375,000 |
No other historical records.
19, Haw Grove, Hellifield, Skipton BD23 4JA

| Today | See what it's worth now |
| 31 Jan 2025 | £195,000 |
| 30 Jun 2021 | £171,000 |
31, Thorndale Street, Hellifield, Skipton BD23 4JE
| Today | See what it's worth now |
| 17 Jan 2025 | £227,500 |
| 18 Dec 2007 | £185,000 |
22, Newton Way, Hellifield, Skipton BD23 4NY

| Today | See what it's worth now |
| 19 Dec 2024 | £325,000 |
| 30 Mar 2012 | £215,000 |
7, Rowan Lane, Hellifield, Skipton BD23 4JG
| Today | See what it's worth now |
| 5 Dec 2024 | £390,000 |
| 18 Jul 2017 | £295,000 |
1, The Mews, Park Avenue, Hellifield, Skipton BD23 4JU
| Today | See what it's worth now |
| 15 Nov 2024 | £155,000 |
| 1 Oct 2001 | £59,500 |
No other historical records.
8, Rowan Lane, Hellifield, Skipton BD23 4JG

| Today | See what it's worth now |
| 8 Nov 2024 | £346,555 |
| 30 Jun 2005 | £265,000 |

Source Acknowledgement: © Crown copyright. England and Wales house price data is publicly available information produced by the HM Land Registry.This material was last updated on 9 July 2026. It covers the period from 1 January 1995 to 30 April 2026 and contains property transactions which have been registered during that period. Contains HM Land Registry data © Crown copyright and database right 2026. This data is licensed under the Open Government Licence v3.0.
Disclaimer: Rightmove.co.uk provides this HM Land Registry data "as is". The burden for fitness of the data relies completely with the user and is provided for informational purposes only. No warranty, express or implied, is given relating to the accuracy of content of the HM Land Registry data and Rightmove does not accept any liability for error or omission. If you have found an error with the data or need further information please contact HM Land Registry.
Permitted Use: Viewers of this Information are granted permission to access this Crown copyright material and to download it onto electronic, magnetic, optical or similar storage media provided that such activities are for private research, study or in-house use only. Any other use of the material requires the formal written permission of Land Registry which can be requested from us, and is subject to an additional licence and associated charge.
Rightmove takes no liability for your use of, or reliance on, Rightmove's Instant Valuation due to the limitations of our tracking tool listed here. Use of this tool is taken entirely at your own risk. All rights reserved.