
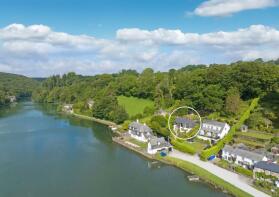
House Prices in Higher Penpoll
House prices in Higher Penpoll have an overall average of £353,993 over the last year.
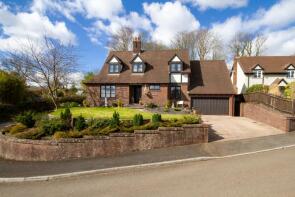
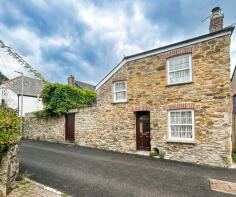
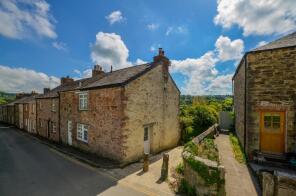
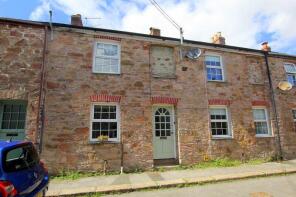
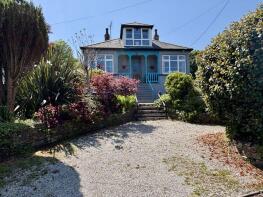
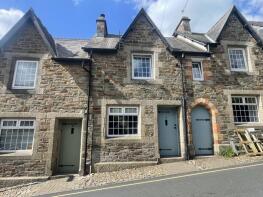
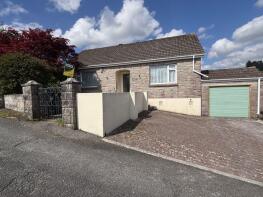
The majority of properties sold in Higher Penpoll during the last year were terraced properties, selling for an average price of £256,643. Detached properties sold for an average of £595,400, with flats fetching £234,458.
Overall, the historical sold prices in Higher Penpoll over the last year were similar to the previous year and 7% down on the 2023 peak of £380,261.
Properties Sold
5, Gilbury Hill, Lostwithiel PL22 0GH

| Today | See what it's worth now |
| 3 Feb 2026 | £160,000 |
| 21 Jan 2014 | £105,000 |
No other historical records.
25 26, Summers Street, Lostwithiel PL22 0DH

| Today | See what it's worth now |
| 22 Jan 2026 | £325,000 |
| 5 Aug 2014 | £258,000 |
No other historical records.
Morladron, Road From Junction North Of Lerryn View To Yonder Cottage, Lostwithiel PL22 0QQ
| Today | See what it's worth now |
| 7 Jan 2026 | £875,000 |
| 18 Apr 2013 | £390,000 |
No other historical records.
1 Marrok House, Knights Court, Lostwithiel PL22 0BE
| Today | See what it's worth now |
| 18 Dec 2025 | £505,000 |
| 16 Nov 2020 | £410,000 |
No other historical records.
10, Church Lane, Lostwithiel PL22 0DA
| Today | See what it's worth now |
| 16 Dec 2025 | £226,000 |
| 17 Mar 2016 | £189,000 |
28, Summers Street, Lostwithiel PL22 0DH
| Today | See what it's worth now |
| 12 Dec 2025 | £205,000 |
No other historical records.
18, Uzella Park, Lostwithiel PL22 0BB
| Today | See what it's worth now |
| 3 Dec 2025 | £150,000 |
| 17 Aug 2006 | £125,000 |
No other historical records.
11, Grenville Road, Lostwithiel PL22 0EP
| Today | See what it's worth now |
| 28 Nov 2025 | £225,000 |
| 5 Dec 2019 | £178,000 |
22 Petroc Cottage, Grenville Road, Lostwithiel PL22 0EP
| Today | See what it's worth now |
| 14 Nov 2025 | £238,000 |
| 20 Apr 2018 | £190,000 |
16, Brunel Quays, Great Western Village, Lostwithiel PL22 0JB
| Today | See what it's worth now |
| 17 Oct 2025 | £515,000 |
| 25 Jun 2021 | £400,000 |
Bide-a-wee, Scrations Lane, Lostwithiel PL22 0SL
| Today | See what it's worth now |
| 3 Oct 2025 | £439,000 |
| 15 Sep 2017 | £201,500 |
No other historical records.
4, Addison Terrace, Bodmin Hill, Lostwithiel PL22 0AL
| Today | See what it's worth now |
| 30 Sep 2025 | £300,000 |
| 16 Feb 2023 | £300,000 |
Harmounigh, Grenville Road, Lostwithiel PL22 0EP


| Today | See what it's worth now |
| 30 Sep 2025 | £300,000 |
| 9 Aug 2001 | £74,950 |
No other historical records.
Trenoweth, Rose Hill, Lostwithiel PL22 0DQ

| Today | See what it's worth now |
| 12 Sep 2025 | £445,000 |
| 12 Feb 2020 | £250,000 |
20, Grenville Road, Lostwithiel PL22 0EP
| Today | See what it's worth now |
| 12 Sep 2025 | £270,000 |
| 26 Jun 2020 | £225,000 |
The Grange, Manely, St. Veep, St Veep PL22 0NS
| Today | See what it's worth now |
| 1 Sep 2025 | £1,050,000 |
| 13 Mar 2023 | £1,130,000 |
6, King Street, Lostwithiel PL22 0AQ
| Today | See what it's worth now |
| 27 Aug 2025 | £310,000 |
| 20 Jul 2023 | £305,000 |
Green-ways, Scrations Lane, Lostwithiel PL22 0DP
| Today | See what it's worth now |
| 26 Aug 2025 | £600,000 |
No other historical records.
7, Bodmin Hill, Lostwithiel PL22 0AH
| Today | See what it's worth now |
| 15 Aug 2025 | £295,000 |
| 13 Sep 2013 | £152,000 |
No other historical records.
Sundown, Hillside Gardens, Lostwithiel PL22 0DB
| Today | See what it's worth now |
| 15 Aug 2025 | £305,000 |
No other historical records.
2, Charterhouse, Albert Terrace, Lostwithiel PL22 0AF
| Today | See what it's worth now |
| 8 Aug 2025 | £175,000 |
| 6 Jan 2017 | £95,000 |
No other historical records.
6, The Moors, Lostwithiel PL22 0BX
| Today | See what it's worth now |
| 29 Jul 2025 | £135,000 |
| 30 May 2014 | £177,000 |
No other historical records.
5, Rosehill Close, Lostwithiel PL22 0HH
| Today | See what it's worth now |
| 28 Jul 2025 | £230,000 |
| 5 Sep 2001 | £77,000 |
No other historical records.
3, Montfort House, Cardinham Close, Lostwithiel PL22 0GD

| Today | See what it's worth now |
| 28 Jul 2025 | £112,750 |
| 31 Aug 2018 | £90,750 |
No other historical records.
The Mount, Restormel Road, Lostwithiel PL22 0EE
| Today | See what it's worth now |
| 24 Jul 2025 | £635,000 |
No other historical records.
Source Acknowledgement: © Crown copyright. England and Wales house price data is publicly available information produced by the HM Land Registry.This material was last updated on 9 April 2026. It covers the period from 1 January 1995 to 27 February 2026 and contains property transactions which have been registered during that period. Contains HM Land Registry data © Crown copyright and database right 2026. This data is licensed under the Open Government Licence v3.0.
Disclaimer: Rightmove.co.uk provides this HM Land Registry data "as is". The burden for fitness of the data relies completely with the user and is provided for informational purposes only. No warranty, express or implied, is given relating to the accuracy of content of the HM Land Registry data and Rightmove does not accept any liability for error or omission. If you have found an error with the data or need further information please contact HM Land Registry.
Permitted Use: Viewers of this Information are granted permission to access this Crown copyright material and to download it onto electronic, magnetic, optical or similar storage media provided that such activities are for private research, study or in-house use only. Any other use of the material requires the formal written permission of Land Registry which can be requested from us, and is subject to an additional licence and associated charge.
Map data ©OpenStreetMap contributors.
Rightmove takes no liability for your use of, or reliance on, Rightmove's Instant Valuation due to the limitations of our tracking tool listed here. Use of this tool is taken entirely at your own risk. All rights reserved.