
House Prices in Hockley
House prices in Hockley have an overall average of £482,825 over the last year.
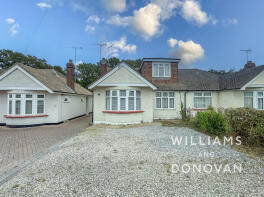
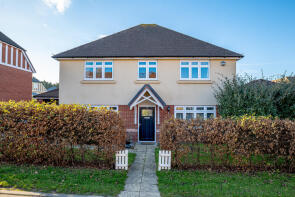
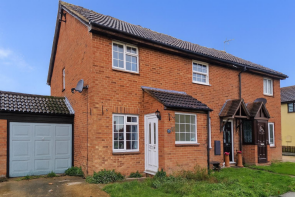
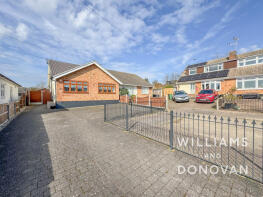
The majority of properties sold in Hockley during the last year were semi-detached properties, selling for an average price of £414,540. Detached properties sold for an average of £627,922, with terraced properties fetching £362,909.
Overall, the historical sold prices in Hockley over the last year were 7% up on the previous year and 10% down on the 2022 peak of £535,883.
Properties Sold
20, Hawkwell Road, Hockley SS5 4DA

| Today | See what it's worth now |
| 24 Apr 2026 | £545,000 |
| 25 May 2006 | £278,000 |
No other historical records.
74, Main Road, Hockley SS5 4RF

| Today | See what it's worth now |
| 17 Apr 2026 | £750,000 |
| 8 Apr 2016 | £440,000 |
100a, Plumberow Avenue, Hockley SS5 5AG
| Today | See what it's worth now |
| 2 Apr 2026 | £480,000 |
| 12 Mar 2019 | £253,000 |
No other historical records.
5, 21 Oak Lodge, Southend Road, Hockley SS5 4PQ

| Today | See what it's worth now |
| 31 Mar 2026 | £230,000 |
| 20 Mar 2019 | £220,000 |
77, Hawkwell Chase, Hockley SS5 4NE

| Today | See what it's worth now |
| 30 Mar 2026 | £420,000 |
| 19 Sep 2014 | £225,000 |
No other historical records.
74, Buckingham Road, Hockley SS5 4UE

| Today | See what it's worth now |
| 26 Mar 2026 | £417,700 |
No other historical records.
19, Elizabeth Close, Hockley SS5 4NQ
| Today | See what it's worth now |
| 19 Mar 2026 | £435,000 |
| 26 Oct 2006 | £189,000 |
21, Sweyne Avenue, Hockley SS5 4LB
| Today | See what it's worth now |
| 13 Mar 2026 | £375,000 |
| 1 Nov 2002 | £137,995 |
No other historical records.
264, Plumberow Avenue, Hockley SS5 5NT
| Today | See what it's worth now |
| 12 Mar 2026 | £815,000 |
| 29 Nov 2002 | £250,000 |
No other historical records.
41, Buckingham Road, Hockley SS5 4UX
| Today | See what it's worth now |
| 12 Mar 2026 | £410,000 |
| 17 Jan 2020 | £310,000 |
46, Hamilton Gardens, Hockley SS5 5BX
| Today | See what it's worth now |
| 12 Mar 2026 | £380,000 |
| 21 May 2021 | £363,000 |
70, Thorpe Road, Hockley SS5 4JT
| Today | See what it's worth now |
| 6 Mar 2026 | £600,000 |
| 15 Dec 2014 | £494,995 |
No other historical records.
84, Buckingham Road, Hockley SS5 4UE
| Today | See what it's worth now |
| 6 Mar 2026 | £310,000 |
| 22 Jan 2013 | £175,000 |
No other historical records.
3, Gregory Close, Hockley SS5 4NF
| Today | See what it's worth now |
| 6 Mar 2026 | £425,000 |
| 30 Jun 2014 | £271,000 |
No other historical records.
24, Hamilton Gardens, Hockley SS5 5BU
| Today | See what it's worth now |
| 5 Mar 2026 | £372,500 |
| 29 Aug 1996 | £67,000 |
No other historical records.
14, Laburnum Grove, Hockley SS5 4SG

| Today | See what it's worth now |
| 5 Mar 2026 | £466,500 |
| 6 Dec 2002 | £210,000 |
No other historical records.
51, Belchamps Way, Hockley SS5 4NU
| Today | See what it's worth now |
| 5 Mar 2026 | £575,000 |
| 31 Oct 1997 | £59,995 |
No other historical records.
21, Broad Walk, Hockley SS5 5DD

| Today | See what it's worth now |
| 27 Feb 2026 | £405,000 |
| 22 Jun 2015 | £225,000 |
38, Plumberow Avenue, Hockley SS5 5AB
| Today | See what it's worth now |
| 19 Feb 2026 | £332,500 |
No other historical records.
16, Belvedere Avenue, Hockley SS5 4UL
| Today | See what it's worth now |
| 19 Feb 2026 | £520,000 |
| 16 Jul 1999 | £110,059 |
No other historical records.
10, Caernarvon Close, Hockley SS5 4XH
| Today | See what it's worth now |
| 16 Feb 2026 | £425,000 |
| 2 Aug 2024 | £390,000 |
224, Rectory Road, Hockley SS5 4LG
| Today | See what it's worth now |
| 16 Feb 2026 | £390,000 |
| 30 Oct 1997 | £82,000 |
No other historical records.
3, Cornhill Avenue, Hockley SS5 5BY
| Today | See what it's worth now |
| 13 Feb 2026 | £400,000 |
| 22 Aug 2022 | £400,000 |
Source Acknowledgement: © Crown copyright. England and Wales house price data is publicly available information produced by the HM Land Registry.This material was last updated on 9 July 2026. It covers the period from 1 January 1995 to 30 April 2026 and contains property transactions which have been registered during that period. Contains HM Land Registry data © Crown copyright and database right 2026. This data is licensed under the Open Government Licence v3.0.
Disclaimer: Rightmove.co.uk provides this HM Land Registry data "as is". The burden for fitness of the data relies completely with the user and is provided for informational purposes only. No warranty, express or implied, is given relating to the accuracy of content of the HM Land Registry data and Rightmove does not accept any liability for error or omission. If you have found an error with the data or need further information please contact HM Land Registry.
Permitted Use: Viewers of this Information are granted permission to access this Crown copyright material and to download it onto electronic, magnetic, optical or similar storage media provided that such activities are for private research, study or in-house use only. Any other use of the material requires the formal written permission of Land Registry which can be requested from us, and is subject to an additional licence and associated charge.
Rightmove takes no liability for your use of, or reliance on, Rightmove's Instant Valuation due to the limitations of our tracking tool listed here. Use of this tool is taken entirely at your own risk. All rights reserved.