
House Prices in Hollinwood
House prices in Hollinwood have an overall average of £201,013 over the last year.
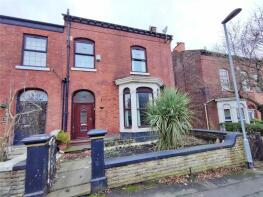
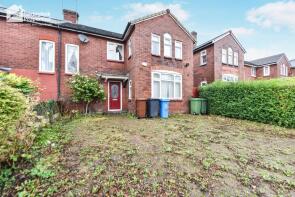
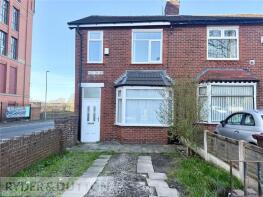
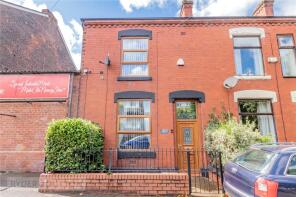
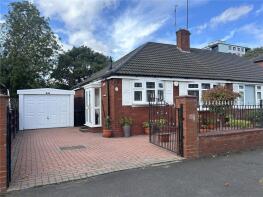
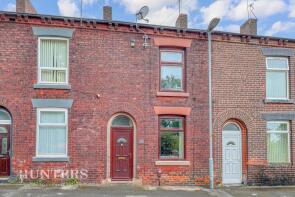
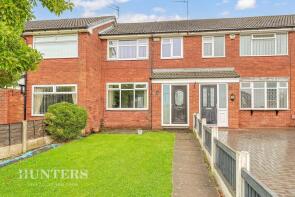
The majority of properties sold in Hollinwood during the last year were terraced properties, selling for an average price of £178,294. Semi-detached properties sold for an average of £222,696, with detached properties fetching £311,889.
Overall, the historical sold prices in Hollinwood over the last year were 5% up on the previous year and 22% up on the 2023 peak of £164,931.
Properties Sold
55, Cheviot Avenue, Oldham OL8 4HD
| Today | See what it's worth now |
| 17 Apr 2026 | £199,995 |
| 15 Nov 2019 | £135,000 |
No other historical records.
21, Croft Brow, Oldham OL8 3AJ
| Today | See what it's worth now |
| 16 Apr 2026 | £60,000 |
| 28 Jan 2003 | £110,000 |
38, County Street, Oldham OL8 3RN

| Today | See what it's worth now |
| 9 Apr 2026 | £133,500 |
| 5 Oct 2017 | £66,500 |
No other historical records.
13, Alton Street, Oldham OL8 3EY
| Today | See what it's worth now |
| 1 Apr 2026 | £140,000 |
| 21 Apr 2006 | £55,000 |
112, Repton Avenue, Oldham OL8 4JD

| Today | See what it's worth now |
| 31 Mar 2026 | £184,500 |
| 3 Jan 2014 | £102,000 |
21, Barmouth Walk, Oldham OL8 4SH

| Today | See what it's worth now |
| 27 Mar 2026 | £180,000 |
| 6 Nov 2017 | £113,000 |
265, Frederick Street, Oldham OL8 4HX
| Today | See what it's worth now |
| 23 Mar 2026 | £249,000 |
| 14 Jul 1995 | £54,000 |
No other historical records.
22, Mulmount Close, Oldham OL8 4NA
| Today | See what it's worth now |
| 17 Mar 2026 | £245,000 |
| 19 Sep 2003 | £68,000 |
11, Rising Lane, Oldham OL8 3AN

| Today | See what it's worth now |
| 13 Mar 2026 | £315,000 |
| 24 Jul 2002 | £93,000 |
No other historical records.
66, Windsor Road, Oldham OL8 4AL
| Today | See what it's worth now |
| 12 Mar 2026 | £290,000 |
| 28 May 2004 | £170,000 |
46, Poplar Avenue, Oldham OL8 3TZ
| Today | See what it's worth now |
| 12 Mar 2026 | £240,000 |
| 28 Nov 2014 | £112,500 |
No other historical records.
133, Coppice Street, Oldham OL8 4BH
| Today | See what it's worth now |
| 27 Feb 2026 | £255,000 |
No other historical records.
8, Penn Street, Oldham OL8 1TU
| Today | See what it's worth now |
| 27 Feb 2026 | £85,000 |
| 29 Mar 2017 | £60,000 |
No other historical records.
1, Merton Avenue, Oldham OL8 4JE
| Today | See what it's worth now |
| 26 Feb 2026 | £187,000 |
| 24 May 2013 | £36,000 |
892, Ashton Road, Oldham OL8 3HT
| Today | See what it's worth now |
| 20 Feb 2026 | £177,000 |
| 16 Dec 2016 | £85,000 |
56, Montgomery Street, Oldham OL8 3QA
| Today | See what it's worth now |
| 20 Feb 2026 | £220,000 |
| 16 Nov 2006 | £120,000 |
13, Watts Street, Oldham OL8 3TN
| Today | See what it's worth now |
| 20 Feb 2026 | £150,000 |
| 28 Feb 2019 | £78,500 |
18, Swallow Street, Oldham OL8 4LD
| Today | See what it's worth now |
| 13 Feb 2026 | £215,000 |
| 17 Jan 2020 | £123,500 |
52, Green Lane, Oldham OL8 3AY
| Today | See what it's worth now |
| 12 Feb 2026 | £224,000 |
| 21 Dec 1999 | £53,000 |
No other historical records.
7, Alton Street, Oldham OL8 3EY

| Today | See what it's worth now |
| 2 Feb 2026 | £50,000 |
| 28 Feb 2020 | £53,000 |
44, Whitebank Road, Oldham OL8 3JJ
| Today | See what it's worth now |
| 30 Jan 2026 | £302,000 |
| 29 Sep 2017 | £166,995 |
No other historical records.
40, Rowan Tree Road, Oldham OL8 3LG
| Today | See what it's worth now |
| 30 Jan 2026 | £238,000 |
| 26 May 2017 | £131,995 |
No other historical records.
35, Third Avenue, Oldham OL8 3SD
| Today | See what it's worth now |
| 16 Jan 2026 | £202,000 |
No other historical records.
Source Acknowledgement: © Crown copyright. England and Wales house price data is publicly available information produced by the HM Land Registry.This material was last updated on 9 July 2026. It covers the period from 1 January 1995 to 30 April 2026 and contains property transactions which have been registered during that period. Contains HM Land Registry data © Crown copyright and database right 2026. This data is licensed under the Open Government Licence v3.0.
Disclaimer: Rightmove.co.uk provides this HM Land Registry data "as is". The burden for fitness of the data relies completely with the user and is provided for informational purposes only. No warranty, express or implied, is given relating to the accuracy of content of the HM Land Registry data and Rightmove does not accept any liability for error or omission. If you have found an error with the data or need further information please contact HM Land Registry.
Permitted Use: Viewers of this Information are granted permission to access this Crown copyright material and to download it onto electronic, magnetic, optical or similar storage media provided that such activities are for private research, study or in-house use only. Any other use of the material requires the formal written permission of Land Registry which can be requested from us, and is subject to an additional licence and associated charge.
Rightmove takes no liability for your use of, or reliance on, Rightmove's Instant Valuation due to the limitations of our tracking tool listed here. Use of this tool is taken entirely at your own risk. All rights reserved.