
House Prices in KY1
House prices in KY1 have an overall average of £171,978 over the last year.
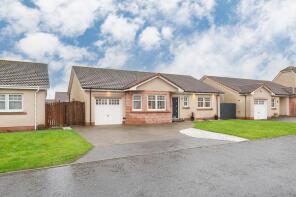
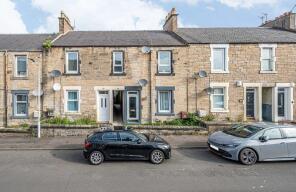
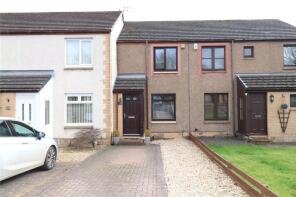
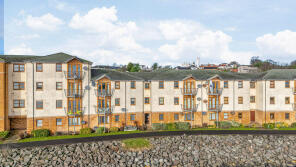
The majority of properties sold in KY1 during the last year were flats, selling for an average price of £105,766. Terraced properties sold for an average of £154,248, with detached properties fetching £284,172.
Overall, the historical sold prices in KY1 over the last year were 2% down on the previous year and 1% up on the 2023 peak of £169,474.
Properties Sold
5, Branxton Avenue, Kirkcaldy KY1 4ET
| Today | See what it's worth now |
| 30 Apr 2026 | £350,000 |
| 21 Apr 2023 | £339,000 |
No other historical records.
87b, Pratt Street, Kirkcaldy KY1 1RY
| Today | See what it's worth now |
| 29 Apr 2026 | £60,000 |
| 17 Jul 2025 | £33,125 |
60, Strathore Road, Strathore, Kirkcaldy KY1 4DY
| Today | See what it's worth now |
| 29 Apr 2026 | £79,500 |
| 1 Sep 2023 | £78,000 |
No other historical records.
5, Holly Place, Kirkcaldy KY1 2LZ
| Today | See what it's worth now |
| 29 Apr 2026 | £135,000 |
| 21 Mar 2019 | £85,500 |
12, Station Court, Bennochy Road, Kirkcaldy KY1 1AF

| Today | See what it's worth now |
| 29 Apr 2026 | £226,000 |
No other historical records.
Flat 3, 291, High Street, Kirkcaldy KY1 1JH

| Today | See what it's worth now |
| 29 Apr 2026 | £93,000 |
| 14 Jan 2026 | £90,000 |
Ground Floor Right, 91a, Pratt Street, Kirkcaldy KY1 1RY
| Today | See what it's worth now |
| 29 Apr 2026 | £30,000 |
| 5 Feb 2024 | £51,250 |
80, Kidd Street, Kirkcaldy KY1 2EE

| Today | See what it's worth now |
| 28 Apr 2026 | £85,000 |
| 9 Dec 2020 | £32,325 |
No other historical records.
51, Deas Wharf, Kirkcaldy KY1 1JJ
| Today | See what it's worth now |
| 28 Apr 2026 | £121,450 |
| 4 Oct 2005 | £131,500 |
No other historical records.
4, Braehead Lodge, Victoria Road, Kirkcaldy KY1 2SA

| Today | See what it's worth now |
| 28 Apr 2026 | £178,000 |
No other historical records.
20, Kingslaw Court, Kirkcaldy KY1 2FH
| Today | See what it's worth now |
| 28 Apr 2026 | £360,995 |
No other historical records.
32, Kelhope View, Kirkcaldy KY1 3BX
| Today | See what it's worth now |
| 28 Apr 2026 | £314,000 |
| 21 Jun 2024 | £305,000 |
No other historical records.
2, The Cross, Kirkcaldy KY1 4SU
| Today | See what it's worth now |
| 28 Apr 2026 | £195,000 |
| 18 Jun 2015 | £79,452 |
No other historical records.
36, Main Street, Coaltown Of Wemyss KY1 4LZ
| Today | See what it's worth now |
| 28 Apr 2026 | £237,995 |
| 24 Apr 2026 | £214,995 |
6, Kelhope View, Kirkcaldy KY1 3BX
| Today | See what it's worth now |
| 27 Apr 2026 | £277,500 |
| 20 Feb 2024 | £237,500 |
No other historical records.
20, Burnbank Terrace, Kirkcaldy KY1 4AW
| Today | See what it's worth now |
| 27 Apr 2026 | £220,750 |
| 10 Jun 2014 | £160,000 |
3, Kinellar Place, Kirkcaldy KY1 4BN
| Today | See what it's worth now |
| 27 Apr 2026 | £359,000 |
| 25 Feb 2025 | £355,000 |
40, Kidd Street, Kirkcaldy KY1 2ED
| Today | See what it's worth now |
| 27 Apr 2026 | £106,000 |
| 22 Nov 2024 | £95,000 |
43, Station Park, Kirkcaldy KY1 4TS
| Today | See what it's worth now |
| 27 Apr 2026 | £120,000 |
| 4 Sep 2006 | £80,000 |
No other historical records.
45, Deas Wharf, Kirkcaldy KY1 1JJ
| Today | See what it's worth now |
| 24 Apr 2026 | £160,000 |
| 5 Apr 2016 | £100,000 |
23, Almond Place, Kirkcaldy KY1 2LD
| Today | See what it's worth now |
| 24 Apr 2026 | £120,501 |
No other historical records.
17, Cross Street, Kirkcaldy KY1 2UD
| Today | See what it's worth now |
| 24 Apr 2026 | £66,000 |
| 28 Jan 2004 | £35,100 |
No other historical records.
30, Kelhope View, Kirkcaldy KY1 3BX

| Today | See what it's worth now |
| 22 Apr 2026 | £272,000 |
No other historical records.
Source Acknowledgement: © Crown copyright. Scottish house price data is publicly available information produced by the Registers of Scotland. Material has been reproduced with the permission of the Keeper of the Registers of Scotland and contains data compiled by Registers of Scotland. For further information, please contact data@ros.gov.uk. Please note the dates shown here relate to the property's registered date not sold date.This material was last updated on 10 July 2026. It covers the period from 8 December 1987 to 30 April 2026 and contains property transactions which have been registered during that period.
Disclaimer: Rightmove.co.uk provides this Registers of Scotland data "as is". The burden for fitness of the data relies completely with the user and is provided for informational purposes only. No warranty, express or implied, is given relating to the accuracy of content of the Registers of Scotland data and Rightmove plc does not accept any liability for error or omission. If you have found an error with the data or need further information please contact data@ros.gov.uk
Permitted Use: The Registers of Scotland allows the reproduction of the data which it provides to Rightmove.co.uk free of charge in any format or medium only for research, private study or for internal circulation within an organisation. This is subject to it being reproduced accurately and not used in a misleading context. The material must be acknowledged as Crown Copyright. You are not allowed to use this information for commercial purposes, nor must you copy, distribute, sell or publish the data in any way. For any other use of this material, please apply to the Registers of Scotland for a licence. You can do this online at www.ros.gov.uk, by email at data@ros.gov.uk or by writing to Business Development, Registers of Scotland, Meadowbank House, 153 London Road, Edinburgh EH8 7AU.
Rightmove takes no liability for your use of, or reliance on, Rightmove's Instant Valuation due to the limitations of our tracking tool listed here. Use of this tool is taken entirely at your own risk. All rights reserved.