
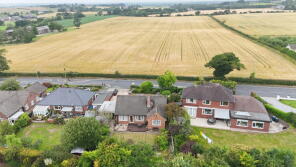
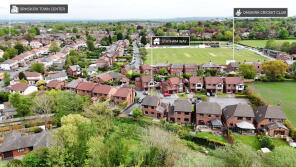
House Prices in L39
House prices in L39 have an overall average of £354,010 over the last year.
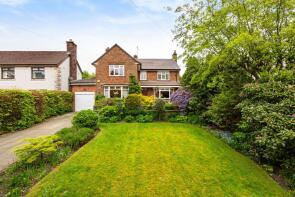
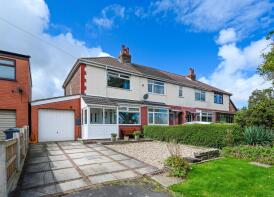
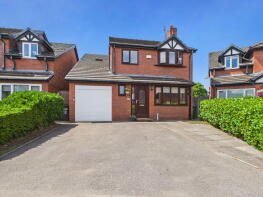
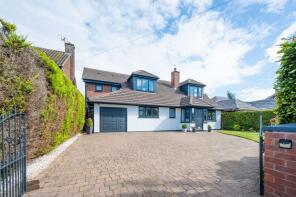
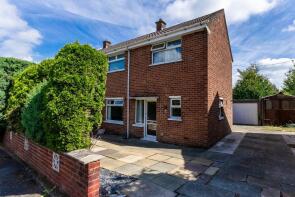
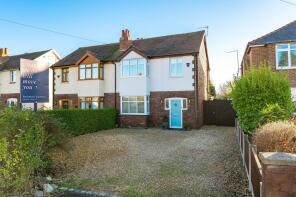
The majority of properties sold in L39 during the last year were semi-detached properties, selling for an average price of £305,884. Detached properties sold for an average of £569,792, with terraced properties fetching £220,485.
Overall, the historical sold prices in L39 over the last year were 9% up on the previous year and 7% up on the 2023 peak of £330,702.
Properties Sold
13, Turnpike Road, Ormskirk L39 3LD
| Today | See what it's worth now |
| 20 Apr 2026 | £360,000 |
| 14 Nov 2001 | £177,000 |
12, Chestnut Court, Ormskirk L39 2JB
| Today | See what it's worth now |
| 2 Apr 2026 | £198,000 |
| 24 Feb 2017 | £160,000 |
13, Narrow Croft Road, Ormskirk L39 5ER
| Today | See what it's worth now |
| 2 Apr 2026 | £375,000 |
| 10 Jan 2014 | £230,000 |
Extensions and planning permission in L39
See planning approval stats, extension build costs and value added estimates.

184, Southport Road, Ormskirk L39 1LZ
| Today | See what it's worth now |
| 27 Mar 2026 | £220,000 |
| 5 Nov 2021 | £170,000 |
16, Carroll Crescent, Ormskirk L39 1PZ

| Today | See what it's worth now |
| 27 Mar 2026 | £202,500 |
| 25 May 2022 | £189,000 |
71, St Helens Road, Ormskirk L39 4QW
| Today | See what it's worth now |
| 26 Mar 2026 | £725,000 |
| 7 Apr 2011 | £410,000 |
No other historical records.
37, Asmall Lane, Ormskirk L39 3BG
| Today | See what it's worth now |
| 19 Mar 2026 | £215,000 |
| 16 May 2005 | £165,000 |
4, Pine Crest, Ormskirk L39 5HX

| Today | See what it's worth now |
| 18 Mar 2026 | £185,000 |
| 18 Feb 2020 | £138,000 |
11, Halsall Court, Ormskirk L39 3PU
| Today | See what it's worth now |
| 13 Mar 2026 | £115,000 |
| 12 Dec 2003 | £82,500 |
20, Brook Farm Close, Ormskirk L39 4YA
| Today | See what it's worth now |
| 12 Mar 2026 | £450,000 |
| 4 Dec 2020 | £144,000 |
10, Statham Way, Ormskirk L39 4XR
| Today | See what it's worth now |
| 10 Mar 2026 | £395,000 |
| 22 Feb 2008 | £280,000 |
No other historical records.
23, Brookfield Lane, Ormskirk L39 6SN
| Today | See what it's worth now |
| 6 Mar 2026 | £650,000 |
| 30 Jun 2021 | £570,000 |
129, Burscough Street, Ormskirk L39 2EP
| Today | See what it's worth now |
| 3 Mar 2026 | £233,000 |
No other historical records.
6, Cotton Drive, Ormskirk L39 3AZ
| Today | See what it's worth now |
| 27 Feb 2026 | £180,000 |
| 23 Jul 2014 | £129,295 |
75, Whalley Drive, Ormskirk L39 6RD

| Today | See what it's worth now |
| 27 Feb 2026 | £320,000 |
| 26 Aug 2022 | £245,000 |
63, County Road, Ormskirk L39 1QG
| Today | See what it's worth now |
| 27 Feb 2026 | £325,000 |
| 15 Feb 2008 | £210,000 |
32, Wimbrick Crescent, Ormskirk L39 4TB
| Today | See what it's worth now |
| 20 Feb 2026 | £340,000 |
| 5 Sep 2012 | £200,000 |
No other historical records.
4, Owen Avenue, Ormskirk L39 1QB

| Today | See what it's worth now |
| 20 Feb 2026 | £222,500 |
| 26 May 2023 | £146,500 |
No other historical records.
6, The Serpentine, Ormskirk L39 6RW
| Today | See what it's worth now |
| 16 Feb 2026 | £335,000 |
| 7 Feb 2002 | £134,000 |
No other historical records.
57, Delph Park Avenue, Aughton L39 5DE
| Today | See what it's worth now |
| 13 Feb 2026 | £373,000 |
| 20 Oct 2023 | £357,000 |
No other historical records.
28, Brookfield Lane, Aughton L39 6SP

| Today | See what it's worth now |
| 12 Feb 2026 | £312,000 |
| 7 Aug 2003 | £197,500 |
No other historical records.
11, Warpers Way, Ormskirk L39 4AS
| Today | See what it's worth now |
| 12 Feb 2026 | £230,000 |
| 16 Dec 2011 | £185,995 |
No other historical records.
5, Stone Yard Close, Ormskirk L39 2AF
| Today | See what it's worth now |
| 12 Feb 2026 | £443,000 |
| 26 Apr 2013 | £261,000 |
No other historical records.
Source Acknowledgement: © Crown copyright. England and Wales house price data is publicly available information produced by the HM Land Registry.This material was last updated on 9 July 2026. It covers the period from 1 January 1995 to 30 April 2026 and contains property transactions which have been registered during that period. Contains HM Land Registry data © Crown copyright and database right 2026. This data is licensed under the Open Government Licence v3.0.
Disclaimer: Rightmove.co.uk provides this HM Land Registry data "as is". The burden for fitness of the data relies completely with the user and is provided for informational purposes only. No warranty, express or implied, is given relating to the accuracy of content of the HM Land Registry data and Rightmove does not accept any liability for error or omission. If you have found an error with the data or need further information please contact HM Land Registry.
Permitted Use: Viewers of this Information are granted permission to access this Crown copyright material and to download it onto electronic, magnetic, optical or similar storage media provided that such activities are for private research, study or in-house use only. Any other use of the material requires the formal written permission of Land Registry which can be requested from us, and is subject to an additional licence and associated charge.
Rightmove takes no liability for your use of, or reliance on, Rightmove's Instant Valuation due to the limitations of our tracking tool listed here. Use of this tool is taken entirely at your own risk. All rights reserved.