
House Prices in Langham
House prices in Langham have an overall average of £465,725 over the last year.
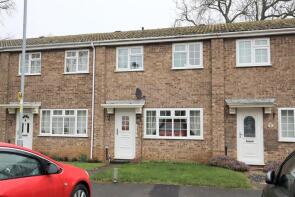
The majority of properties sold in Langham during the last year were detached properties, selling for an average price of £527,156. Terraced properties sold for an average of £220,000.
Overall, the historical sold prices in Langham over the last year were 31% up on the previous year and 17% down on the 2022 peak of £560,150.
Properties Sold
7, Harewood Close, Oakham LE15 7JZ
| Today | See what it's worth now |
| 20 Mar 2026 | £175,000 |
| 12 Feb 2021 | £200,000 |
29 New England Cottage, Melton Road, Oakham LE15 7JN
| Today | See what it's worth now |
| 12 Mar 2026 | £265,000 |
| 17 Jun 2021 | £276,000 |
6, Melton Road, Oakham LE15 7JN
| Today | See what it's worth now |
| 20 Nov 2025 | £452,250 |
| 9 Dec 2016 | £325,000 |
25 The Maltings, Harewood Close, Oakham LE15 7JZ

| Today | See what it's worth now |
| 17 Nov 2025 | £525,000 |
| 22 Jul 2019 | £433,000 |
Meadow Edge, Burley Road, Oakham LE15 7HZ
| Today | See what it's worth now |
| 15 Oct 2025 | £925,000 |
| 18 Dec 2020 | £350,000 |
No other historical records.
11 The Old Bakehouse, Melton Road, Oakham LE15 7JN
| Today | See what it's worth now |
| 11 Sep 2025 | £550,000 |
| 23 Aug 2004 | £485,000 |
32a, Well Street, Oakham LE15 7JS

| Today | See what it's worth now |
| 28 Aug 2025 | £400,000 |
| 4 Oct 2016 | £337,000 |
3 Westbank, Church Street, Oakham LE15 7JE
| Today | See what it's worth now |
| 4 Aug 2025 | £565,000 |
| 27 Nov 2015 | £430,000 |
10, Orchard Road, Langham LE15 7JP
| Today | See what it's worth now |
| 23 Jul 2025 | £495,000 |
No other historical records.
18 Southfield, Burley Road, Oakham LE15 7HY
| Today | See what it's worth now |
| 2 Jul 2025 | £305,000 |
| 12 Mar 2021 | £300,000 |
19, Harewood Close, Oakham LE15 7JZ
| Today | See what it's worth now |
| 2 Apr 2025 | £490,000 |
| 16 Sep 2016 | £340,000 |
5, Ruddle Way, Oakham LE15 7NZ
| Today | See what it's worth now |
| 21 Mar 2025 | £290,000 |
| 13 Oct 2006 | £185,000 |
23, Cold Overton Road, Oakham LE15 7JG
| Today | See what it's worth now |
| 30 Jan 2025 | £460,000 |
| 26 Aug 2011 | £250,000 |
No other historical records.
2, Sharrads Way, Oakham LE15 7JY

| Today | See what it's worth now |
| 10 Jan 2025 | £530,000 |
| 9 Dec 2016 | £389,000 |
8, Church Street, Oakham LE15 7JE

| Today | See what it's worth now |
| 2 Dec 2024 | £470,000 |
| 23 Sep 2019 | £350,000 |
The Granary, The Old Hall Stables, Church Street, Langham LE15 7JE
| Today | See what it's worth now |
| 15 Nov 2024 | £600,000 |
| 6 Sep 2016 | £430,000 |
30, Burley Road, Langham LE15 7HY
| Today | See what it's worth now |
| 15 Nov 2024 | £320,000 |
No other historical records.
12, Ruddle Way, Oakham LE15 7NZ

| Today | See what it's worth now |
| 8 Oct 2024 | £550,000 |
| 28 Sep 2001 | £214,950 |
No other historical records.
4 Breconia, Cold Overton Road, Oakham LE15 7JG
| Today | See what it's worth now |
| 22 Aug 2024 | £290,000 |
| 5 Sep 2017 | £450,000 |
40, Ruddle Way, Oakham LE15 7NZ

| Today | See what it's worth now |
| 21 May 2024 | £143,260 |
| 4 Nov 2004 | £87,120 |
30, Ruddle Way, Oakham LE15 7NZ
| Today | See what it's worth now |
| 17 May 2024 | £154,375 |
| 27 Sep 2002 | £64,000 |
No other historical records.
48, Ruddle Way, Oakham LE15 7NZ

| Today | See what it's worth now |
| 16 May 2024 | £132,326 |
| 13 Sep 2002 | £55,000 |
No other historical records.
26, Melton Road, Langham LE15 7JN
| Today | See what it's worth now |
| 3 May 2024 | £202,500 |
No other historical records.
4, The Range, Oakham LE15 7EB
| Today | See what it's worth now |
| 15 Mar 2024 | £610,000 |
No other historical records.
2, Melton Road, Oakham LE15 7JN

| Today | See what it's worth now |
| 15 Mar 2024 | £355,000 |
No other historical records.
Source Acknowledgement: © Crown copyright. England and Wales house price data is publicly available information produced by the HM Land Registry.This material was last updated on 15 May 2026. It covers the period from 1 January 1995 to 31 March 2026 and contains property transactions which have been registered during that period. Contains HM Land Registry data © Crown copyright and database right 2026. This data is licensed under the Open Government Licence v3.0.
Disclaimer: Rightmove.co.uk provides this HM Land Registry data "as is". The burden for fitness of the data relies completely with the user and is provided for informational purposes only. No warranty, express or implied, is given relating to the accuracy of content of the HM Land Registry data and Rightmove does not accept any liability for error or omission. If you have found an error with the data or need further information please contact HM Land Registry.
Permitted Use: Viewers of this Information are granted permission to access this Crown copyright material and to download it onto electronic, magnetic, optical or similar storage media provided that such activities are for private research, study or in-house use only. Any other use of the material requires the formal written permission of Land Registry which can be requested from us, and is subject to an additional licence and associated charge.
Map data ©OpenStreetMap contributors.
Rightmove takes no liability for your use of, or reliance on, Rightmove's Instant Valuation due to the limitations of our tracking tool listed here. Use of this tool is taken entirely at your own risk. All rights reserved.