
House Prices in Langley Marsh
House prices in Langley Marsh have an overall average of £325,873 over the last year.
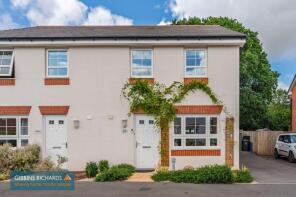
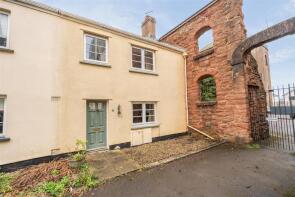
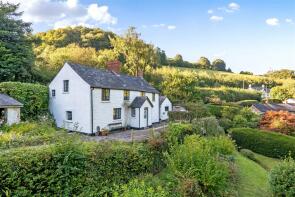
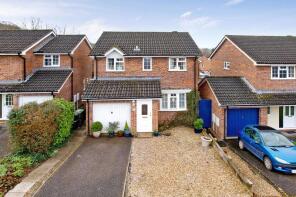
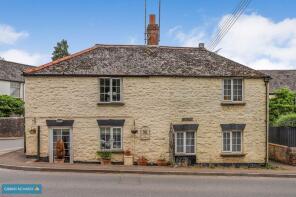
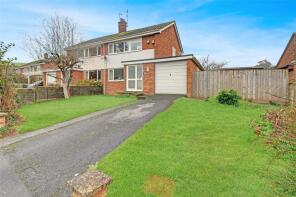
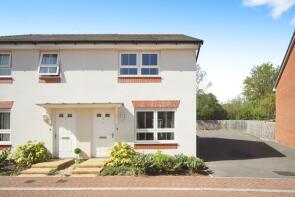
The majority of properties sold in Langley Marsh during the last year were detached properties, selling for an average price of £454,250. Terraced properties sold for an average of £243,996, with semi-detached properties fetching £284,000.
Overall, the historical sold prices in Langley Marsh over the last year were 2% up on the previous year and 18% down on the 2022 peak of £399,623.
Properties Sold
37, Nordens Meadow, Wiveliscombe, Taunton TA4 2JW

| Today | See what it's worth now |
| 24 Apr 2026 | £215,000 |
| 20 Nov 2020 | £175,000 |
7, Coopers Heights, Wiveliscombe, Taunton TA4 2YB
| Today | See what it's worth now |
| 10 Apr 2026 | £192,500 |
| 1 Nov 2006 | £150,000 |
19, Langdon Road, Wiveliscombe, Taunton TA4 2ET

| Today | See what it's worth now |
| 9 Apr 2026 | £450,000 |
| 17 Jun 2022 | £419,995 |
No other historical records.
15, Rotton Row, Wiveliscombe, Taunton TA4 2NB
| Today | See what it's worth now |
| 8 Apr 2026 | £190,000 |
| 14 Jul 2006 | £166,000 |
36, Golden Hill, Wiveliscombe, Taunton TA4 2NU
| Today | See what it's worth now |
| 31 Mar 2026 | £222,500 |
| 20 Nov 2009 | £129,000 |
Flat 5, The Malthouse, Hauling Way, Wiveliscombe, Taunton TA4 2PP
| Today | See what it's worth now |
| 10 Feb 2026 | £155,000 |
| 25 Apr 2016 | £115,000 |
25, Langdon Road, Wiveliscombe, Taunton TA4 2ET
| Today | See what it's worth now |
| 23 Jan 2026 | £292,000 |
| 27 Jun 2022 | £279,995 |
No other historical records.
Higher Croft, Skilgate Loop Road, Taunton TA4 2DQ
| Today | See what it's worth now |
| 19 Jan 2026 | £470,000 |
No other historical records.
4, The Mews, Golden Hill, Wiveliscombe, Taunton TA4 2NY
| Today | See what it's worth now |
| 16 Jan 2026 | £192,500 |
| 4 May 2005 | £172,500 |
Tonecroft, Waterrow Road, Chipstable, Wiveliscombe TA4 2AX
| Today | See what it's worth now |
| 6 Jan 2026 | £430,000 |
No other historical records.
29, Lion D'angers, Wiveliscombe, Taunton TA4 2PN
| Today | See what it's worth now |
| 6 Jan 2026 | £330,000 |
| 14 Oct 2015 | £233,750 |
Church View, Station Road, Wiveliscombe TA4 2LX
| Today | See what it's worth now |
| 19 Dec 2025 | £235,000 |
| 1 Oct 2014 | £189,950 |
No other historical records.
25, North Street, Wiveliscombe, Taunton TA4 2LA

| Today | See what it's worth now |
| 16 Dec 2025 | £550,000 |
| 2 Sep 2005 | £350,000 |
No other historical records.
Cridlands Barn, Brompton Ralph To Glebe Farm, Taunton TA4 2RU
| Today | See what it's worth now |
| 16 Dec 2025 | £745,000 |
| 17 Oct 2018 | £640,000 |
Newhouse, Upton, Dulverton TA4 2JA
| Today | See what it's worth now |
| 5 Dec 2025 | £415,000 |
| 12 Aug 1999 | £120,000 |
No other historical records.
16, Dixon Close, Wiveliscombe, Taunton TA4 2BT
| Today | See what it's worth now |
| 4 Dec 2025 | £315,000 |
| 24 Jun 2016 | £217,000 |
No other historical records.
2, Palace Gardens, Wiveliscombe, Taunton TA4 2LU

| Today | See what it's worth now |
| 14 Nov 2025 | £440,000 |
| 12 Mar 2014 | £247,500 |
1, Taunton Road, Wiveliscombe, Taunton TA4 2NH
| Today | See what it's worth now |
| 31 Oct 2025 | £152,950 |
| 1 Jul 2022 | £150,000 |
6, Southfield, Wiveliscombe, Taunton TA4 2NQ
| Today | See what it's worth now |
| 17 Oct 2025 | £310,000 |
| 21 Aug 2020 | £195,000 |
Laburnam Cottage, Langley Marsh Road, Wiveliscombe TA4 2UJ
| Today | See what it's worth now |
| 17 Oct 2025 | £302,500 |
No other historical records.
2a, Ford Road, Wiveliscombe, Taunton TA4 2NJ

| Today | See what it's worth now |
| 17 Oct 2025 | £450,000 |
| 2 Oct 2020 | £340,000 |
2, Thorne Close, Wiveliscombe TA4 2ER
| Today | See what it's worth now |
| 17 Oct 2025 | £112,000 |
No other historical records.
Upingtons, High Street, Wiveliscombe TA4 2JX
| Today | See what it's worth now |
| 19 Sep 2025 | £350,000 |
No other historical records.

Source Acknowledgement: © Crown copyright. England and Wales house price data is publicly available information produced by the HM Land Registry.This material was last updated on 9 July 2026. It covers the period from 1 January 1995 to 30 April 2026 and contains property transactions which have been registered during that period. Contains HM Land Registry data © Crown copyright and database right 2026. This data is licensed under the Open Government Licence v3.0.
Disclaimer: Rightmove.co.uk provides this HM Land Registry data "as is". The burden for fitness of the data relies completely with the user and is provided for informational purposes only. No warranty, express or implied, is given relating to the accuracy of content of the HM Land Registry data and Rightmove does not accept any liability for error or omission. If you have found an error with the data or need further information please contact HM Land Registry.
Permitted Use: Viewers of this Information are granted permission to access this Crown copyright material and to download it onto electronic, magnetic, optical or similar storage media provided that such activities are for private research, study or in-house use only. Any other use of the material requires the formal written permission of Land Registry which can be requested from us, and is subject to an additional licence and associated charge.
Rightmove takes no liability for your use of, or reliance on, Rightmove's Instant Valuation due to the limitations of our tracking tool listed here. Use of this tool is taken entirely at your own risk. All rights reserved.