
House Prices in Layton
House prices in Layton have an overall average of £146,112 over the last year.
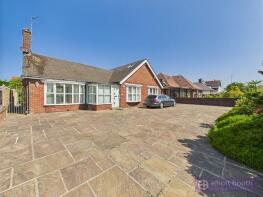
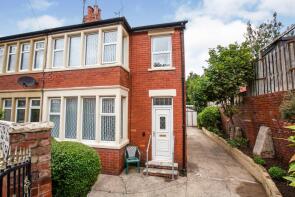
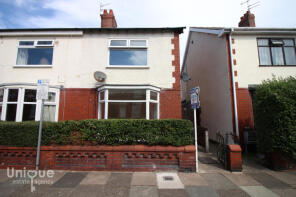
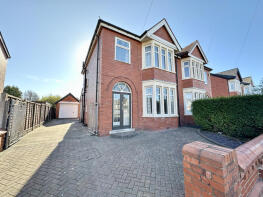
The majority of properties sold in Layton during the last year were semi-detached properties, selling for an average price of £146,263. Terraced properties sold for an average of £113,401, with detached properties fetching £311,550.
Overall, the historical sold prices in Layton over the last year were similar to the previous year and 2% up on the 2022 peak of £143,719.
Properties Sold
Flat 7, 50 Grizedale Court, Forest Gate, Blackpool FY3 9AP

| Today | See what it's worth now |
| 14 Apr 2026 | £63,500 |
| 25 Jan 2017 | £40,000 |
7, Garrick Grove, Blackpool FY3 7DD

| Today | See what it's worth now |
| 10 Apr 2026 | £111,000 |
| 26 Feb 2021 | £72,500 |
40, Lakeway, Blackpool FY3 8PF
| Today | See what it's worth now |
| 2 Apr 2026 | £157,000 |
| 12 Feb 2016 | £116,750 |
183, Layton Road, Blackpool FY3 8ES
| Today | See what it's worth now |
| 31 Mar 2026 | £140,000 |
| 10 Apr 2024 | £75,000 |
No other historical records.
45, Sherwood Avenue, Blackpool FY3 7HT
| Today | See what it's worth now |
| 27 Mar 2026 | £122,000 |
| 29 Sep 2003 | £66,000 |
No other historical records.
28, Grange Road, Blackpool FY3 8EJ
| Today | See what it's worth now |
| 23 Mar 2026 | £112,000 |
| 20 Jun 2011 | £84,000 |
19, Brierley Avenue, Blackpool FY3 8HP
| Today | See what it's worth now |
| 12 Mar 2026 | £100,000 |
| 31 May 2018 | £73,000 |
3, Collingwood Avenue, Blackpool FY3 8DE
| Today | See what it's worth now |
| 2 Mar 2026 | £140,000 |
| 3 Sep 2025 | £100,000 |
16, Jackson Street, Blackpool FY3 7BZ

| Today | See what it's worth now |
| 27 Feb 2026 | £88,000 |
| 4 Feb 2022 | £83,000 |
8, Burwood Drive, Blackpool FY3 8NS
| Today | See what it's worth now |
| 27 Feb 2026 | £272,000 |
| 30 Sep 2014 | £210,000 |
16, Camden Road, Blackpool FY3 8HN
| Today | See what it's worth now |
| 27 Feb 2026 | £83,000 |
| 2 Jun 1999 | £26,250 |
22, Broughton Avenue, Blackpool FY3 8EQ
| Today | See what it's worth now |
| 20 Feb 2026 | £79,000 |
| 13 Jan 2022 | £84,000 |
8, Cumbrian Avenue, Blackpool FY3 8RQ
| Today | See what it's worth now |
| 20 Feb 2026 | £129,000 |
| 24 Aug 2001 | £58,000 |
21, Croydon Road, Blackpool FY3 7DB
| Today | See what it's worth now |
| 19 Feb 2026 | £78,000 |
| 15 Jul 2008 | £92,000 |
33, Birchway Avenue, Blackpool FY3 8EZ
| Today | See what it's worth now |
| 16 Feb 2026 | £144,000 |
| 19 May 2006 | £114,000 |
No other historical records.
78, Grenfell Avenue, Blackpool FY3 7BS
| Today | See what it's worth now |
| 13 Feb 2026 | £120,000 |
| 3 Aug 2018 | £79,950 |
81, Westcliffe Drive, Blackpool FY3 7DH
| Today | See what it's worth now |
| 12 Feb 2026 | £229,950 |
No other historical records.
6, Oregon Avenue, Blackpool FY3 7JU
| Today | See what it's worth now |
| 30 Jan 2026 | £170,000 |
| 19 Feb 2019 | £126,000 |
No other historical records.
164, Layton Road, Blackpool FY3 8ER
| Today | See what it's worth now |
| 30 Jan 2026 | £185,000 |
| 29 May 2007 | £170,000 |
No other historical records.
234, Newton Drive, Blackpool FY3 8NB
| Today | See what it's worth now |
| 30 Jan 2026 | £330,000 |
| 23 Feb 2018 | £290,000 |
4, Coveway Avenue, Blackpool FY3 8ET
| Today | See what it's worth now |
| 23 Jan 2026 | £150,000 |
| 7 Jan 2021 | £103,000 |
No other historical records.
58, Bardsway Avenue, Blackpool FY3 8JR
| Today | See what it's worth now |
| 23 Jan 2026 | £134,000 |
| 22 Jun 2021 | £117,500 |
No other historical records.
9, Grenfell Avenue, Blackpool FY3 7BP
| Today | See what it's worth now |
| 19 Jan 2026 | £108,000 |
| 10 Aug 1998 | £34,000 |
No other historical records.
Source Acknowledgement: © Crown copyright. England and Wales house price data is publicly available information produced by the HM Land Registry.This material was last updated on 9 July 2026. It covers the period from 1 January 1995 to 30 April 2026 and contains property transactions which have been registered during that period. Contains HM Land Registry data © Crown copyright and database right 2026. This data is licensed under the Open Government Licence v3.0.
Disclaimer: Rightmove.co.uk provides this HM Land Registry data "as is". The burden for fitness of the data relies completely with the user and is provided for informational purposes only. No warranty, express or implied, is given relating to the accuracy of content of the HM Land Registry data and Rightmove does not accept any liability for error or omission. If you have found an error with the data or need further information please contact HM Land Registry.
Permitted Use: Viewers of this Information are granted permission to access this Crown copyright material and to download it onto electronic, magnetic, optical or similar storage media provided that such activities are for private research, study or in-house use only. Any other use of the material requires the formal written permission of Land Registry which can be requested from us, and is subject to an additional licence and associated charge.
Rightmove takes no liability for your use of, or reliance on, Rightmove's Instant Valuation due to the limitations of our tracking tool listed here. Use of this tool is taken entirely at your own risk. All rights reserved.