
House Prices in Lenches
House prices in Lenches have an overall average of £190,190 over the last year.
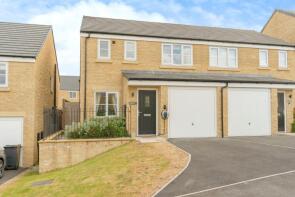
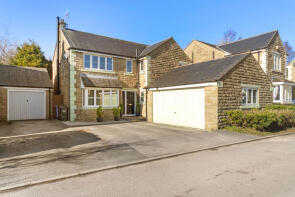
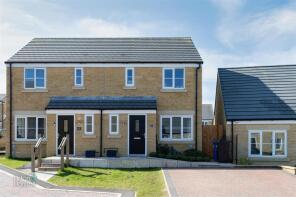
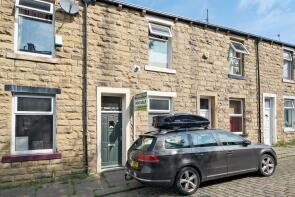
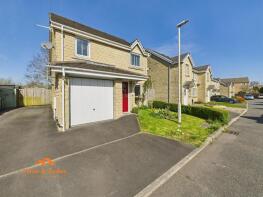
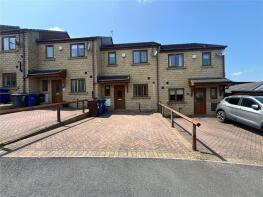
The majority of properties sold in Lenches during the last year were terraced properties, selling for an average price of £160,598. Semi-detached properties sold for an average of £208,327, with detached properties fetching £289,375.
Overall, the historical sold prices in Lenches over the last year were 5% up on the previous year and 4% up on the 2021 peak of £183,262.
Properties Sold
14, Briercliffe Avenue, Colne BB8 8JL

| Today | See what it's worth now |
| 23 Dec 2025 | £135,000 |
| 11 Jun 2021 | £135,000 |
7, Lanky Gardens, Colne BB8 8FJ


| Today | See what it's worth now |
| 19 Dec 2025 | £202,000 |
| 18 Oct 2023 | £192,000 |
12, Lanky Gardens, Colne BB8 8FJ
| Today | See what it's worth now |
| 12 Dec 2025 | £300,000 |
| 31 Jul 2020 | £189,995 |
No other historical records.
75, Knotts Mount, Colne BB8 8DZ
| Today | See what it's worth now |
| 12 Dec 2025 | £196,500 |
| 19 Dec 2018 | £148,995 |
No other historical records.
101, Skipton Road, Colne BB8 8TE

| Today | See what it's worth now |
| 8 Dec 2025 | £52,000 |
| 9 Mar 2017 | £181,000 |
No other historical records.
34, Hollin Hall, Colne BB8 8SS
| Today | See what it's worth now |
| 3 Dec 2025 | £212,500 |
| 27 Oct 2023 | £198,000 |
8, Skipton Road, Trawden BB8 8QS
| Today | See what it's worth now |
| 28 Nov 2025 | £168,000 |
No other historical records.
1, Paddock Top Mews, Colne BB8 8FD

| Today | See what it's worth now |
| 27 Nov 2025 | £135,000 |
| 27 Oct 2006 | £143,955 |
No other historical records.
3, Church View, Colne BB8 8SA
| Today | See what it's worth now |
| 27 Nov 2025 | £166,000 |
| 28 Mar 2024 | £165,000 |
No other historical records.
6, Gill Street, Colne BB8 8JQ

| Today | See what it's worth now |
| 24 Nov 2025 | £167,500 |
| 30 Jan 2004 | £51,000 |
No other historical records.
25, Hall Meadows, Colne BB8 8RJ
| Today | See what it's worth now |
| 20 Nov 2025 | £90,000 |
| 6 Nov 1995 | £25,500 |
No other historical records.
15, Beacon Close, Colne BB8 8BG
| Today | See what it's worth now |
| 14 Nov 2025 | £250,000 |
| 31 Jan 2000 | £83,000 |
3, Bankfield Street, Colne BB8 8BL
| Today | See what it's worth now |
| 14 Nov 2025 | £186,000 |
| 19 Dec 2014 | £124,000 |
23, Rowling Hollins, Colne BB8 8FH
| Today | See what it's worth now |
| 14 Nov 2025 | £220,000 |
| 10 Sep 2021 | £177,000 |
No other historical records.
443, Burnley Road, Colne BB8 8LA

| Today | See what it's worth now |
| 12 Nov 2025 | £245,000 |
No other historical records.
3, Carleton Road, Colne BB8 8JP

| Today | See what it's worth now |
| 12 Nov 2025 | £189,950 |
No other historical records.
3, Rye Croft, Colne BB8 8TH

| Today | See what it's worth now |
| 7 Nov 2025 | £285,000 |
| 29 Jun 2007 | £240,000 |
No other historical records.
5, Weavers Court, Colne BB8 8NW
| Today | See what it's worth now |
| 7 Nov 2025 | £375,000 |
| 20 Oct 2017 | £305,000 |
5, Slack Booth, Colne BB8 8SR

| Today | See what it's worth now |
| 7 Nov 2025 | £295,000 |
| 11 Dec 2015 | £153,000 |
No other historical records.
5, Tum Hill Close, Colne BB8 8FG
| Today | See what it's worth now |
| 6 Nov 2025 | £195,000 |
| 23 Jun 2023 | £195,000 |
No other historical records.
15, Atkinson Street, Colne BB8 8AT
| Today | See what it's worth now |
| 31 Oct 2025 | £57,500 |
| 2 Jun 1995 | £15,000 |
No other historical records.
15, St Georges Close, Colne BB8 8DP
| Today | See what it's worth now |
| 7 Oct 2025 | £258,000 |
| 27 Apr 2001 | £83,450 |
No other historical records.
2, The Sidings, Colne BB8 8EQ
| Today | See what it's worth now |
| 7 Oct 2025 | £160,000 |
| 27 May 2016 | £121,000 |
No other historical records.
8, Sydney Terrace, Colne BB8 8RH
| Today | See what it's worth now |
| 1 Oct 2025 | £186,500 |
| 20 Dec 2017 | £92,500 |
No other historical records.
26, Peerart Court, Colne BB8 8EH

| Today | See what it's worth now |
| 18 Sep 2025 | £70,000 |
| 29 Apr 2003 | £50,000 |
No other historical records.
Source Acknowledgement: © Crown copyright. England and Wales house price data is publicly available information produced by the HM Land Registry.This material was last updated on 4 February 2026. It covers the period from 1 January 1995 to 24 December 2025 and contains property transactions which have been registered during that period. Contains HM Land Registry data © Crown copyright and database right 2026. This data is licensed under the Open Government Licence v3.0.
Disclaimer: Rightmove.co.uk provides this HM Land Registry data "as is". The burden for fitness of the data relies completely with the user and is provided for informational purposes only. No warranty, express or implied, is given relating to the accuracy of content of the HM Land Registry data and Rightmove does not accept any liability for error or omission. If you have found an error with the data or need further information please contact HM Land Registry.
Permitted Use: Viewers of this Information are granted permission to access this Crown copyright material and to download it onto electronic, magnetic, optical or similar storage media provided that such activities are for private research, study or in-house use only. Any other use of the material requires the formal written permission of Land Registry which can be requested from us, and is subject to an additional licence and associated charge.
Map data ©OpenStreetMap contributors.
Rightmove takes no liability for your use of, or reliance on, Rightmove's Instant Valuation due to the limitations of our tracking tool listed here. Use of this tool is taken entirely at your own risk. All rights reserved.