
House Prices in Lower Higham
House prices in Lower Higham have an overall average of £420,874 over the last year.
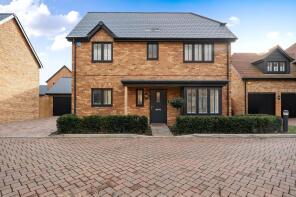
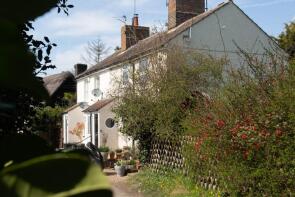
The majority of properties sold in Lower Higham during the last year were semi-detached properties, selling for an average price of £410,725. Detached properties sold for an average of £555,917, with terraced properties fetching £276,200.
Overall, the historical sold prices in Lower Higham over the last year were 1% up on the previous year and 10% down on the 2023 peak of £465,889.
Properties Sold
Norton, Mortimers Avenue, Cliffe Woods, Rochester ME3 8JT
| Today | See what it's worth now |
| 12 Dec 2025 | £635,000 |
| 14 May 2021 | £535,000 |
No other historical records.
12, Battlesmere Road, Cliffe Woods, Rochester ME3 8TR
| Today | See what it's worth now |
| 27 Nov 2025 | £460,000 |
| 8 Jul 2016 | £335,000 |
15 Semloh, Highwoods Close, Higham, Rochester ME3 7BQ
| Today | See what it's worth now |
| 24 Nov 2025 | £425,000 |
| 14 Jan 2013 | £222,500 |
46, Rookery Crescent, Cliffe, Rochester ME3 7RH
| Today | See what it's worth now |
| 3 Nov 2025 | £270,000 |
| 29 Feb 2024 | £255,000 |
36, Telegraph Hill, Higham, Rochester ME3 7NW
| Today | See what it's worth now |
| 21 Oct 2025 | £620,000 |
| 27 Nov 2009 | £345,000 |
No other historical records.
1, Maple Cottages, Cooling Road, Cliffe, Rochester ME3 7SB
| Today | See what it's worth now |
| 20 Oct 2025 | £430,000 |
| 1 Dec 2020 | £385,000 |
Spadgers Cottage, Well Penn Road, Cliffe, Rochester ME3 7SD
| Today | See what it's worth now |
| 17 Oct 2025 | £390,000 |
| 23 Oct 2015 | £225,000 |
No other historical records.
17, Round Top Close, Cliffe Woods, Rochester ME3 8GZ
| Today | See what it's worth now |
| 17 Oct 2025 | £370,000 |
| 18 Jun 2021 | £340,000 |
No other historical records.
45 Newlands, Town Road, Cliffe Woods, Rochester ME3 8JX

| Today | See what it's worth now |
| 10 Oct 2025 | £410,000 |
| 7 Nov 2019 | £300,000 |
14, Gore Green Cottages, Gore Green Road, Higham, Rochester ME3 7HJ
| Today | See what it's worth now |
| 30 Sep 2025 | £450,000 |
| 29 Nov 2023 | £425,000 |
5, Villa Road, Higham, Rochester ME3 7BS

| Today | See what it's worth now |
| 26 Sep 2025 | £307,500 |
| 16 Apr 1999 | £85,000 |
No other historical records.
50, School Lane, Higham, Rochester ME3 7JF
| Today | See what it's worth now |
| 26 Sep 2025 | £480,000 |
| 4 Oct 2018 | £318,000 |
No other historical records.
15, St Johns Road, Higham, Rochester ME3 7BZ
| Today | See what it's worth now |
| 19 Sep 2025 | £420,000 |
| 5 Nov 2010 | £210,000 |
No other historical records.
3, High View, Higham, Rochester ME3 7HR
| Today | See what it's worth now |
| 19 Sep 2025 | £405,000 |
| 15 Mar 2000 | £128,995 |
No other historical records.
53, Oak Drive, Higham, Rochester ME3 7BD
| Today | See what it's worth now |
| 19 Sep 2025 | £380,000 |
| 3 Jun 2004 | £173,000 |
No other historical records.
Pinewoods, School Lane, Higham, Rochester ME3 7JF
| Today | See what it's worth now |
| 16 Sep 2025 | £407,500 |
| 9 Sep 2016 | £300,000 |
No other historical records.
3, Copperfield House, Chequers Court, Higham, Rochester ME3 7HZ
| Today | See what it's worth now |
| 15 Sep 2025 | £180,000 |
| 19 Dec 2012 | £145,000 |
No other historical records.
18, The Braes, Higham, Rochester ME3 7NA

| Today | See what it's worth now |
| 15 Sep 2025 | £290,000 |
| 8 Jun 2015 | £220,000 |
189, Church Street, Cliffe, Rochester ME3 7QF
| Today | See what it's worth now |
| 10 Sep 2025 | £347,500 |
| 2 Jun 2017 | £270,000 |
34, Brice Road, Higham, Rochester ME3 7AB
| Today | See what it's worth now |
| 8 Sep 2025 | £375,000 |
No other historical records.
31, Rookery Crescent, Cliffe, Rochester ME3 7RH
| Today | See what it's worth now |
| 5 Sep 2025 | £525,000 |
| 14 Feb 2020 | £211,000 |
No other historical records.
Bridgewater, Chalk Road, Higham, Rochester ME3 7LA
| Today | See what it's worth now |
| 5 Sep 2025 | £565,000 |
| 29 May 1997 | £80,500 |
No other historical records.
2, Syringa Cottages, Cooling Road, Cliffe, Rochester ME3 7SA
| Today | See what it's worth now |
| 11 Aug 2025 | £500,000 |
No other historical records.
38, Oakleigh Grove, Cliffe Woods, Rochester ME3 8GY
| Today | See what it's worth now |
| 7 Aug 2025 | £490,000 |
| 12 Aug 2022 | £385,000 |
No other historical records.
3, Church Cottages, Church Street, Higham, Rochester ME3 7LR
| Today | See what it's worth now |
| 5 Aug 2025 | £268,000 |
No other historical records.
Source Acknowledgement: © Crown copyright. England and Wales house price data is publicly available information produced by the HM Land Registry.This material was last updated on 4 February 2026. It covers the period from 1 January 1995 to 24 December 2025 and contains property transactions which have been registered during that period. Contains HM Land Registry data © Crown copyright and database right 2026. This data is licensed under the Open Government Licence v3.0.
Disclaimer: Rightmove.co.uk provides this HM Land Registry data "as is". The burden for fitness of the data relies completely with the user and is provided for informational purposes only. No warranty, express or implied, is given relating to the accuracy of content of the HM Land Registry data and Rightmove does not accept any liability for error or omission. If you have found an error with the data or need further information please contact HM Land Registry.
Permitted Use: Viewers of this Information are granted permission to access this Crown copyright material and to download it onto electronic, magnetic, optical or similar storage media provided that such activities are for private research, study or in-house use only. Any other use of the material requires the formal written permission of Land Registry which can be requested from us, and is subject to an additional licence and associated charge.
Map data ©OpenStreetMap contributors.
Rightmove takes no liability for your use of, or reliance on, Rightmove's Instant Valuation due to the limitations of our tracking tool listed here. Use of this tool is taken entirely at your own risk. All rights reserved.