
House Prices in Maybush
House prices in Maybush have an overall average of £253,350 over the last year.
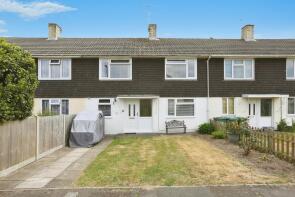
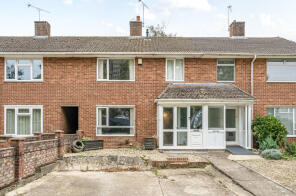
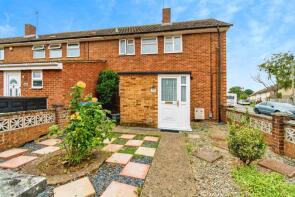
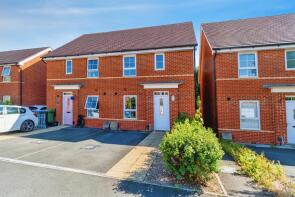
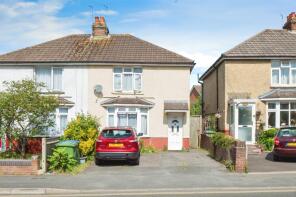
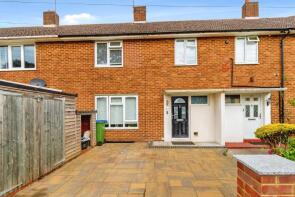
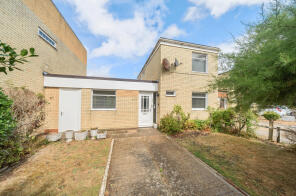
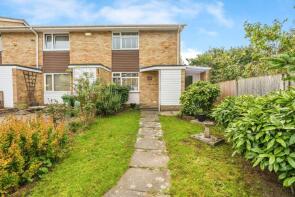
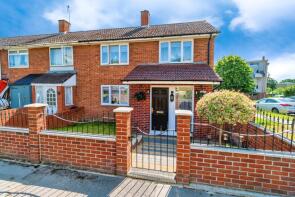
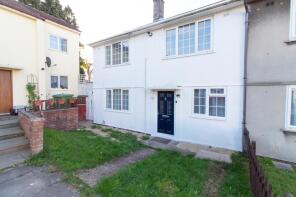
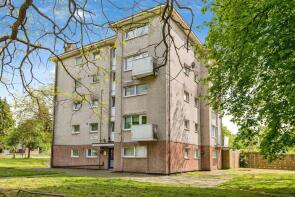
The majority of properties sold in Maybush during the last year were terraced properties, selling for an average price of £266,787. Semi-detached properties sold for an average of £279,191, with flats fetching £142,600.
Overall, the historical sold prices in Maybush over the last year were 2% up on the previous year and 7% up on the 2022 peak of £236,003.
Properties Sold
319, Lower Brownhill Road, Southampton SO16 9LG
| Today | See what it's worth now |
| 16 Apr 2026 | £260,000 |
No other historical records.
60, Cardinal Place, Southampton SO16 4HN
| Today | See what it's worth now |
| 7 Apr 2026 | £210,000 |
| 18 Dec 2014 | £169,950 |
No other historical records.
477, Romsey Road, Southampton SO16 9GJ
| Today | See what it's worth now |
| 27 Mar 2026 | £310,000 |
| 13 Dec 1996 | £57,500 |
No other historical records.
74, Kern Close, Southampton SO16 9RD

| Today | See what it's worth now |
| 27 Mar 2026 | £322,500 |
No other historical records.
94, Cowley Close, Southampton SO16 9WE
| Today | See what it's worth now |
| 25 Mar 2026 | £256,000 |
| 22 May 2020 | £192,500 |
5, Kern Close, Southampton SO16 9RA

| Today | See what it's worth now |
| 23 Mar 2026 | £118,000 |
No other historical records.
9, Larch Road, Southampton SO16 5ES
| Today | See what it's worth now |
| 19 Mar 2026 | £300,000 |
| 5 May 2017 | £199,000 |
20, Irving Road, Southampton SO16 4DZ
| Today | See what it's worth now |
| 16 Mar 2026 | £255,000 |
| 21 Jul 2023 | £250,000 |
No other historical records.
156, Evenlode Road, Southampton SO16 9EF
| Today | See what it's worth now |
| 16 Mar 2026 | £267,500 |
| 26 Jan 2007 | £149,950 |
No other historical records.
42, Borrowdale Road, Southampton SO16 9DR
| Today | See what it's worth now |
| 10 Mar 2026 | £211,550 |
| 3 Apr 2020 | £187,000 |
3, Welland Green, Southampton SO16 9DL
| Today | See what it's worth now |
| 6 Mar 2026 | £295,000 |
| 2 Nov 2020 | £212,000 |
11, Cardinal Place, Southampton SO16 4HR
| Today | See what it's worth now |
| 24 Feb 2026 | £315,000 |
| 13 Jun 2014 | £236,500 |
No other historical records.
309, Wimpson Lane, Southampton SO16 4PW
| Today | See what it's worth now |
| 23 Feb 2026 | £222,500 |
| 19 Dec 2006 | £157,000 |
41, Sedbergh Road, Southampton SO16 9GZ
| Today | See what it's worth now |
| 19 Feb 2026 | £297,000 |
| 27 Sep 2019 | £190,000 |
No other historical records.
7, Braishfield Close, Southampton SO16 4EW
| Today | See what it's worth now |
| 19 Feb 2026 | £205,000 |
No other historical records.
69a, Crabwood Road, Southampton SO16 9FD
| Today | See what it's worth now |
| 16 Feb 2026 | £260,000 |
| 18 Aug 2014 | £145,000 |
62, Paignton Road, Southampton SO16 4NE
| Today | See what it's worth now |
| 16 Feb 2026 | £280,000 |
| 29 Jan 2016 | £190,000 |
No other historical records.
62, Atherfield Road, Southampton SO16 9NG
| Today | See what it's worth now |
| 13 Feb 2026 | £200,000 |
| 28 Mar 2023 | £177,500 |
No other historical records.
266, Wimpson Lane, Southampton SO16 4QA
| Today | See what it's worth now |
| 13 Feb 2026 | £145,000 |
| 21 Feb 2020 | £125,000 |
144, Kendal Avenue, Southampton SO16 9LW
| Today | See what it's worth now |
| 13 Feb 2026 | £297,000 |
No other historical records.
47, Thirlmere Road, Southampton SO16 9FL

| Today | See what it's worth now |
| 12 Feb 2026 | £234,500 |
No other historical records.
527, Romsey Road, Southampton SO16 9GR
| Today | See what it's worth now |
| 6 Feb 2026 | £325,000 |
| 15 Mar 2019 | £270,000 |
47, Alderney Close, Southampton SO16 9QB
| Today | See what it's worth now |
| 5 Feb 2026 | £225,000 |
| 31 Mar 2021 | £185,000 |
Source Acknowledgement: © Crown copyright. England and Wales house price data is publicly available information produced by the HM Land Registry.This material was last updated on 9 July 2026. It covers the period from 1 January 1995 to 30 April 2026 and contains property transactions which have been registered during that period. Contains HM Land Registry data © Crown copyright and database right 2026. This data is licensed under the Open Government Licence v3.0.
Disclaimer: Rightmove.co.uk provides this HM Land Registry data "as is". The burden for fitness of the data relies completely with the user and is provided for informational purposes only. No warranty, express or implied, is given relating to the accuracy of content of the HM Land Registry data and Rightmove does not accept any liability for error or omission. If you have found an error with the data or need further information please contact HM Land Registry.
Permitted Use: Viewers of this Information are granted permission to access this Crown copyright material and to download it onto electronic, magnetic, optical or similar storage media provided that such activities are for private research, study or in-house use only. Any other use of the material requires the formal written permission of Land Registry which can be requested from us, and is subject to an additional licence and associated charge.
Rightmove takes no liability for your use of, or reliance on, Rightmove's Instant Valuation due to the limitations of our tracking tool listed here. Use of this tool is taken entirely at your own risk. All rights reserved.