
House Prices in Midhurst
House prices in Midhurst have an overall average of £455,960 over the last year.
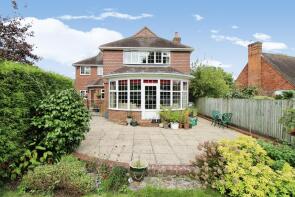
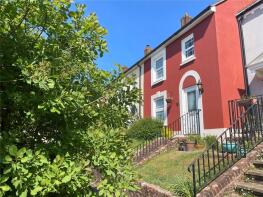
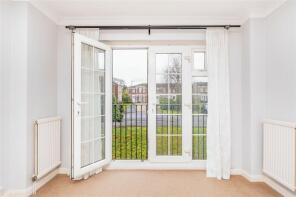
The majority of properties sold in Midhurst during the last year were detached properties, selling for an average price of £675,490. Terraced properties sold for an average of £373,052, with flats fetching £296,265.
Overall, the historical sold prices in Midhurst over the last year were 8% down on the previous year and 9% down on the 2022 peak of £501,546.
Properties Sold
38, Poplar Way, Midhurst GU29 9TA
| Today | See what it's worth now |
| 17 Apr 2026 | £365,000 |
| 2 Jun 2006 | £216,000 |
No other historical records.
Flat 3, Hatton House, Bepton Road, Midhurst GU29 9LU
| Today | See what it's worth now |
| 17 Apr 2026 | £168,000 |
| 17 Feb 2017 | £165,000 |
No other historical records.
5, Clevedon, Ashfield Road, Midhurst GU29 9FG
| Today | See what it's worth now |
| 9 Apr 2026 | £342,000 |
| 18 May 2015 | £250,000 |
34, Pretoria Avenue, Midhurst GU29 9PP
| Today | See what it's worth now |
| 31 Mar 2026 | £635,000 |
| 15 May 2024 | £535,000 |
York House, Knockhundred Row, Midhurst GU29 9DQ
| Today | See what it's worth now |
| 19 Mar 2026 | £340,000 |
| 17 Sep 2004 | £107,500 |
Flat 13, Adelaide House, The Fairway, Midhurst GU29 9JE
| Today | See what it's worth now |
| 13 Mar 2026 | £195,000 |
| 24 Feb 2017 | £180,000 |
13 The Oaks, Carron Lane, Midhurst GU29 9LD
| Today | See what it's worth now |
| 6 Mar 2026 | £665,000 |
| 19 Feb 2020 | £570,000 |
3, The Coach House, June Lane, Midhurst GU29 9EL
| Today | See what it's worth now |
| 23 Feb 2026 | £340,000 |
| 2 Jun 2014 | £290,000 |
6, Gilbert Hannam Close, Midhurst GU29 9FY
| Today | See what it's worth now |
| 13 Feb 2026 | £400,000 |
| 12 Jan 2017 | £329,950 |
No other historical records.
45, Barlavington Way, Midhurst GU29 9TG
| Today | See what it's worth now |
| 12 Feb 2026 | £320,000 |
| 18 Jun 2015 | £300,000 |
12, Forest Road, Midhurst GU29 9FH
| Today | See what it's worth now |
| 30 Jan 2026 | £97,500 |
| 4 Jan 2018 | £92,500 |
Rosemary Cottage, Lamberts Lane, Midhurst GU29 9EA
| Today | See what it's worth now |
| 28 Jan 2026 | £290,000 |
| 27 Oct 2021 | £295,000 |
1, Borough House, North Street, Midhurst GU29 9DX
| Today | See what it's worth now |
| 27 Jan 2026 | £417,500 |
| 11 Dec 2019 | £339,950 |
60, Oakwood Close, Midhurst GU29 9QP
| Today | See what it's worth now |
| 23 Jan 2026 | £199,999 |
| 9 Aug 2006 | £110,000 |
25, Hurst Park, Midhurst GU29 0BP
| Today | See what it's worth now |
| 16 Jan 2026 | £1,127,000 |
| 28 Jun 2021 | £1,000,000 |
4, Pine Close, Midhurst GU29 0FG
| Today | See what it's worth now |
| 14 Jan 2026 | £550,000 |
| 23 Mar 2000 | £186,000 |
No other historical records.
Country View, June Lane, Midhurst GU29 9EL
| Today | See what it's worth now |
| 9 Jan 2026 | £415,000 |
| 21 Nov 2014 | £320,000 |
3, Little Court Close, Midhurst GU29 9SS
| Today | See what it's worth now |
| 23 Dec 2025 | £560,000 |
| 31 Oct 2000 | £285,000 |
No other historical records.
Flat 3, Ashfield Court, Ashfield Road, Midhurst GU29 9JX
| Today | See what it's worth now |
| 18 Dec 2025 | £455,000 |
| 31 Mar 2023 | £136,000 |
12, Egmont Road, Easebourne GU29 9BG
| Today | See what it's worth now |
| 18 Dec 2025 | £450,000 |
No other historical records.
76 Newstead, Petersfield Road, Midhurst GU29 9JR
| Today | See what it's worth now |
| 18 Dec 2025 | £930,000 |
| 24 Jan 2014 | £560,000 |
No other historical records.
24, New Road, Midhurst GU29 9PQ
| Today | See what it's worth now |
| 16 Dec 2025 | £220,000 |
| 29 Sep 2021 | £192,000 |
No other historical records.
55, Poplar Way, Midhurst GU29 9TB
| Today | See what it's worth now |
| 15 Dec 2025 | £322,500 |
| 5 Jul 2004 | £211,000 |
Source Acknowledgement: © Crown copyright. England and Wales house price data is publicly available information produced by the HM Land Registry.This material was last updated on 9 July 2026. It covers the period from 1 January 1995 to 30 April 2026 and contains property transactions which have been registered during that period. Contains HM Land Registry data © Crown copyright and database right 2026. This data is licensed under the Open Government Licence v3.0.
Disclaimer: Rightmove.co.uk provides this HM Land Registry data "as is". The burden for fitness of the data relies completely with the user and is provided for informational purposes only. No warranty, express or implied, is given relating to the accuracy of content of the HM Land Registry data and Rightmove does not accept any liability for error or omission. If you have found an error with the data or need further information please contact HM Land Registry.
Permitted Use: Viewers of this Information are granted permission to access this Crown copyright material and to download it onto electronic, magnetic, optical or similar storage media provided that such activities are for private research, study or in-house use only. Any other use of the material requires the formal written permission of Land Registry which can be requested from us, and is subject to an additional licence and associated charge.
Rightmove takes no liability for your use of, or reliance on, Rightmove's Instant Valuation due to the limitations of our tracking tool listed here. Use of this tool is taken entirely at your own risk. All rights reserved.