
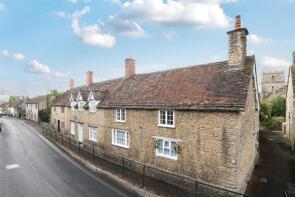
House Prices in Milborne Port
House prices in Milborne Port have an overall average of £297,256 over the last year.
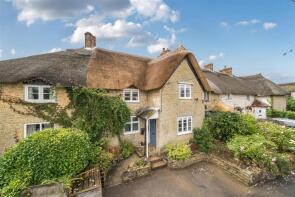
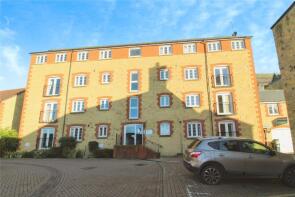
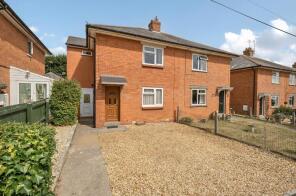
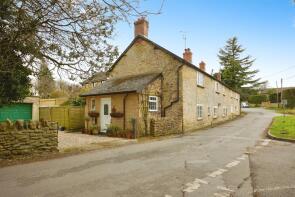
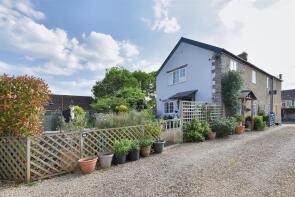
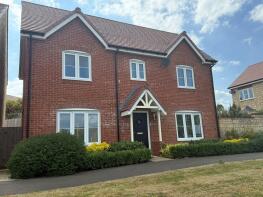
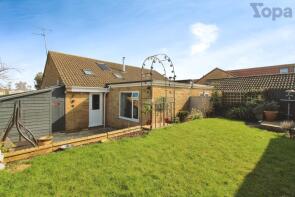
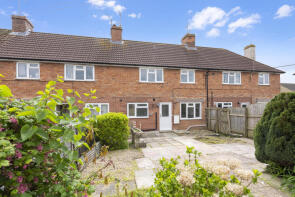
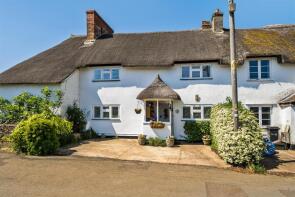
The majority of properties sold in Milborne Port during the last year were terraced properties, selling for an average price of £274,462. Semi-detached properties sold for an average of £291,177, with detached properties fetching £373,889.
Overall, the historical sold prices in Milborne Port over the last year were 9% down on the previous year and 10% down on the 2022 peak of £331,767.
Properties Sold
15, Old Tannery Way, Sherborne DT9 5GA
| Today | See what it's worth now |
| 4 Mar 2026 | £268,000 |
| 15 Feb 2013 | £195,000 |
No other historical records.
Rue Cottage, Station Road, Sherborne DT9 5EQ
| Today | See what it's worth now |
| 27 Feb 2026 | £173,000 |
| 19 Mar 2018 | £163,000 |
44, Prankerds Road, Sherborne DT9 5BX
| Today | See what it's worth now |
| 27 Feb 2026 | £235,000 |
| 7 May 2021 | £210,507 |
No other historical records.
3, Pud Brook, Milborne Port DT9 5RF
| Today | See what it's worth now |
| 27 Feb 2026 | £240,000 |
No other historical records.
204, High Street, Sherborne DT9 5AG
| Today | See what it's worth now |
| 23 Feb 2026 | £345,000 |
| 30 Aug 2016 | £272,000 |
11, Redwing Road, Sherborne DT9 5DB
| Today | See what it's worth now |
| 2 Feb 2026 | £385,000 |
| 3 Aug 2007 | £280,500 |
1, Pud Brook, Sherborne DT9 5RF
| Today | See what it's worth now |
| 30 Jan 2026 | £300,000 |
| 11 Mar 2015 | £200,000 |
Horethorne House, High Street, Sherborne DT9 5AQ
| Today | See what it's worth now |
| 22 Jan 2026 | £378,000 |
| 16 Dec 2011 | £206,000 |
No other historical records.
58, Newtown, Sherborne DT9 5BH
| Today | See what it's worth now |
| 20 Jan 2026 | £270,000 |
| 13 Apr 2018 | £210,000 |
3, Cannon Court Mews, Sherborne DT9 5RD
| Today | See what it's worth now |
| 18 Dec 2025 | £405,000 |
| 11 May 2018 | £330,000 |
21, Prankerds Road, Sherborne DT9 5BX
| Today | See what it's worth now |
| 12 Dec 2025 | £220,000 |
| 30 Sep 1996 | £51,000 |
No other historical records.
94, Brook Street, Sherborne DT9 5DN
| Today | See what it's worth now |
| 12 Dec 2025 | £195,000 |
| 11 May 2018 | £235,000 |
No other historical records.
20, Old Tannery Way, Sherborne DT9 5GA
| Today | See what it's worth now |
| 9 Dec 2025 | £158,000 |
| 5 Apr 2023 | £151,500 |
No other historical records.
62, Manor Road, Sherborne DT9 5BN
| Today | See what it's worth now |
| 5 Dec 2025 | £240,000 |
| 1 Aug 2014 | £175,000 |
112, Rosemary Street, Sherborne DT9 5AR
| Today | See what it's worth now |
| 5 Dec 2025 | £285,000 |
| 5 Aug 2011 | £185,000 |
Heritage Cottage, North Street, Sherborne DT9 5EP
| Today | See what it's worth now |
| 19 Nov 2025 | £320,000 |
| 13 Dec 2018 | £271,500 |
11, Crackmore Drive, Sherborne DT9 5FX
| Today | See what it's worth now |
| 17 Oct 2025 | £515,000 |
| 21 Aug 2020 | £467,995 |
No other historical records.
19, Crackmore Drive, Milborne Port, Sherborne DT9 5FX
| Today | See what it's worth now |
| 14 Oct 2025 | £400,000 |
| 30 Jun 2021 | £335,000 |
No other historical records.
45, Prankerds Road, Sherborne DT9 5BX
| Today | See what it's worth now |
| 10 Oct 2025 | £280,000 |
| 25 Nov 2022 | £220,000 |
6, South View Road, Milborne Port DT9 5BS
| Today | See what it's worth now |
| 26 Sep 2025 | £243,000 |
No other historical records.
45, Newtown, Sherborne DT9 5BJ
| Today | See what it's worth now |
| 26 Sep 2025 | £340,000 |
| 7 Apr 2021 | £225,000 |
No other historical records.
Swatchford Cottage, Lower Kingsbury, Sherborne DT9 5ED
| Today | See what it's worth now |
| 8 Sep 2025 | £555,000 |
| 28 Sep 2018 | £485,000 |
1, Rosemary Street, Sherborne DT9 5AR
| Today | See what it's worth now |
| 5 Sep 2025 | £162,000 |
| 28 Nov 2018 | £146,000 |
No other historical records.
Source Acknowledgement: © Crown copyright. England and Wales house price data is publicly available information produced by the HM Land Registry.This material was last updated on 9 July 2026. It covers the period from 1 January 1995 to 30 April 2026 and contains property transactions which have been registered during that period. Contains HM Land Registry data © Crown copyright and database right 2026. This data is licensed under the Open Government Licence v3.0.
Disclaimer: Rightmove.co.uk provides this HM Land Registry data "as is". The burden for fitness of the data relies completely with the user and is provided for informational purposes only. No warranty, express or implied, is given relating to the accuracy of content of the HM Land Registry data and Rightmove does not accept any liability for error or omission. If you have found an error with the data or need further information please contact HM Land Registry.
Permitted Use: Viewers of this Information are granted permission to access this Crown copyright material and to download it onto electronic, magnetic, optical or similar storage media provided that such activities are for private research, study or in-house use only. Any other use of the material requires the formal written permission of Land Registry which can be requested from us, and is subject to an additional licence and associated charge.
Rightmove takes no liability for your use of, or reliance on, Rightmove's Instant Valuation due to the limitations of our tracking tool listed here. Use of this tool is taken entirely at your own risk. All rights reserved.