
House Prices in Millfields
House prices in Millfields have an overall average of £446,455 over the last year.
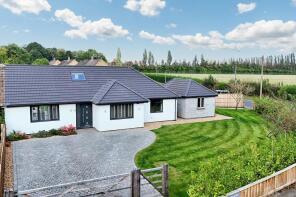
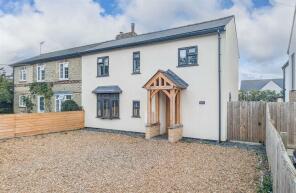
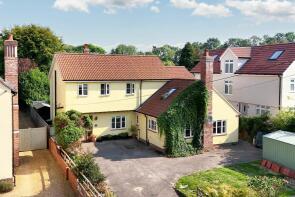
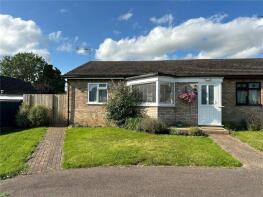
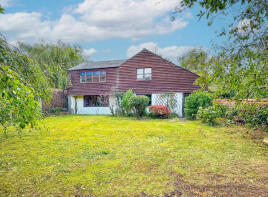
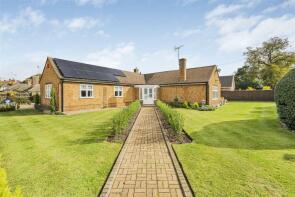
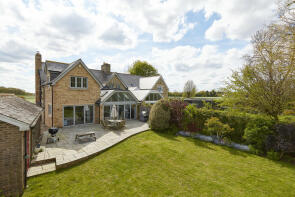
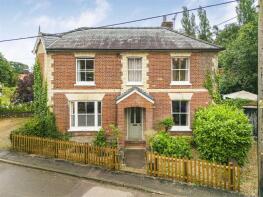
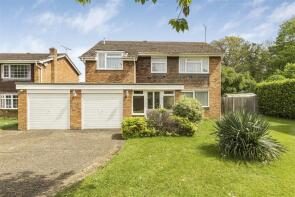
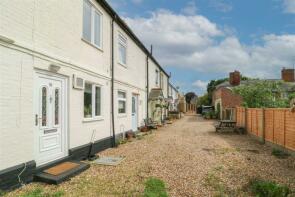
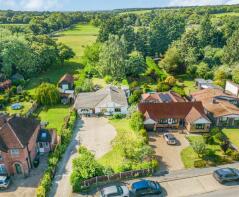
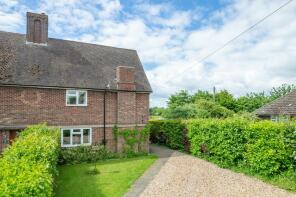
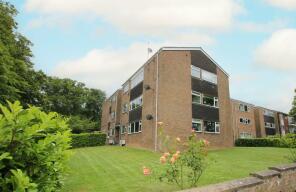
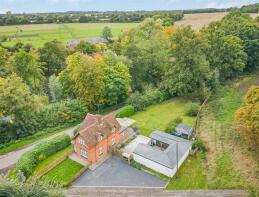
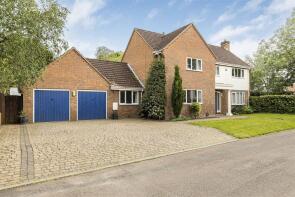
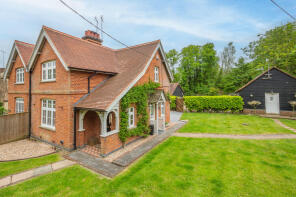
The majority of properties sold in Millfields during the last year were detached properties, selling for an average price of £563,712. Semi-detached properties sold for an average of £403,559, with terraced properties fetching £270,333.
Overall, the historical sold prices in Millfields over the last year were 22% down on the previous year and 20% down on the 2022 peak of £560,773.
Properties Sold
2, Ditton Green, Newmarket CB8 9SQ
| Today | See what it's worth now |
| 31 Mar 2025 | £477,500 |
| 7 Oct 2022 | £295,000 |
No other historical records.
12 Shanklyn Cottage, Cheveley Road, Newmarket CB8 9RN
| Today | See what it's worth now |
| 31 Mar 2025 | £525,000 |
| 7 Aug 2023 | £510,000 |
15, High Street, Newmarket CB8 9DQ
| Today | See what it's worth now |
| 28 Mar 2025 | £740,000 |
| 25 Feb 2002 | £195,000 |
No other historical records.
1, Holland Park, Newmarket CB8 9DL
| Today | See what it's worth now |
| 28 Mar 2025 | £275,000 |
| 5 Aug 2022 | £219,000 |
Granby Cottage, High Street, Stetchworth CB8 9TJ
| Today | See what it's worth now |
| 26 Mar 2025 | £480,000 |
No other historical records.
18 Shangri La, Stretton Avenue, Newmarket CB8 8BN
| Today | See what it's worth now |
| 25 Mar 2025 | £595,000 |
| 18 Nov 2020 | £435,000 |
2 Field View Cottage, Bradley Road, Newmarket CB8 9NG
| Today | See what it's worth now |
| 21 Mar 2025 | £616,000 |
| 30 Jun 2021 | £625,000 |
155, High Street, Newmarket CB8 9DG
| Today | See what it's worth now |
| 13 Mar 2025 | £580,000 |
| 5 Oct 2007 | £424,500 |
26, Little Green, Newmarket CB8 9RG
| Today | See what it's worth now |
| 7 Mar 2025 | £455,000 |
| 1 Feb 2012 | £180,000 |
24, Clarendale Estate, Newmarket CB8 9LN
| Today | See what it's worth now |
| 5 Mar 2025 | £282,500 |
| 25 Jun 2021 | £302,500 |
Pond Cottage, The Street, Newmarket CB8 9PW
| Today | See what it's worth now |
| 28 Feb 2025 | £860,000 |
| 10 Dec 2002 | £429,100 |
No other historical records.
33, Clarendale Estate, Newmarket CB8 9LN
| Today | See what it's worth now |
| 26 Feb 2025 | £285,000 |
| 18 Dec 2013 | £215,000 |
No other historical records.
67, St Johns Avenue, Newmarket CB8 8DE
| Today | See what it's worth now |
| 18 Feb 2025 | £530,000 |
| 1 Jul 1996 | £108,000 |
No other historical records.
18, Newmarket Road, Newmarket CB8 9DR
| Today | See what it's worth now |
| 12 Feb 2025 | £230,000 |
| 25 Aug 2021 | £200,000 |
34, High Street, Newmarket CB8 9DQ
| Today | See what it's worth now |
| 10 Feb 2025 | £603,000 |
| 19 Aug 2016 | £420,000 |
No other historical records.
3, Tillbrooks Hill, Newmarket CB8 9QF
| Today | See what it's worth now |
| 31 Jan 2025 | £326,500 |
| 8 Jun 2018 | £270,000 |
2, Bridlemere Court, Newmarket CB8 9AT
| Today | See what it's worth now |
| 29 Jan 2025 | £210,000 |
| 7 Mar 2017 | £160,000 |
South Lodge, Bradley Road, Newmarket CB8 9QA
| Today | See what it's worth now |
| 24 Jan 2025 | £545,000 |
| 24 Aug 2020 | £370,000 |
No other historical records.
22, High Street, Newmarket CB8 9TJ
| Today | See what it's worth now |
| 21 Jan 2025 | £725,000 |
| 3 May 2012 | £472,500 |
No other historical records.
2, Elms Cottage, Newmarket Road, Newmarket CB8 9QA
| Today | See what it's worth now |
| 3 Jan 2025 | £470,000 |
| 1 Mar 2018 | £399,500 |
11 Cherry Tree Cottage, Broad Green, Newmarket CB8 9RE
| Today | See what it's worth now |
| 3 Jan 2025 | £380,000 |
| 30 Oct 2015 | £250,750 |
37, Fairlawns, Newmarket CB8 9JS
| Today | See what it's worth now |
| 20 Dec 2024 | £250,000 |
| 4 Nov 2016 | £222,500 |
6, Coronation Court, Green Road, Newmarket CB8 9BL
| Today | See what it's worth now |
| 20 Dec 2024 | £225,000 |
| 28 Jan 2008 | £232,500 |
8 Bivalis, Church Lane, Newmarket CB8 9TN
| Today | See what it's worth now |
| 16 Dec 2024 | £875,000 |
| 19 Nov 2015 | £395,000 |
No other historical records.
29, High Street, Newmarket CB8 9DQ
| Today | See what it's worth now |
| 16 Dec 2024 | £457,000 |
| 19 Mar 2019 | £407,000 |
Get ready with a Mortgage in Principle
- Personalised result in just 20 minutes
- Find out how much you can borrow
- Get viewings faster with agents
- No impact on your credit score
What's your property worth?
Source Acknowledgement: © Crown copyright. England and Wales house price data is publicly available information produced by the HM Land Registry.This material was last updated on 16 July 2025. It covers the period from 1 January 1995 to 30 May 2025 and contains property transactions which have been registered during that period. Contains HM Land Registry data © Crown copyright and database right 2025. This data is licensed under the Open Government Licence v3.0.
Disclaimer: Rightmove.co.uk provides this HM Land Registry data "as is". The burden for fitness of the data relies completely with the user and is provided for informational purposes only. No warranty, express or implied, is given relating to the accuracy of content of the HM Land Registry data and Rightmove does not accept any liability for error or omission. If you have found an error with the data or need further information please contact HM Land Registry.
Permitted Use: Viewers of this Information are granted permission to access this Crown copyright material and to download it onto electronic, magnetic, optical or similar storage media provided that such activities are for private research, study or in-house use only. Any other use of the material requires the formal written permission of Land Registry which can be requested from us, and is subject to an additional licence and associated charge.
Map data ©OpenStreetMap contributors.
Rightmove takes no liability for your use of, or reliance on, Rightmove's Instant Valuation due to the limitations of our tracking tool listed here. Use of this tool is taken entirely at your own risk. All rights reserved.