
House Prices in Montpelier
House prices in Montpelier have an overall average of £466,791 over the last year.
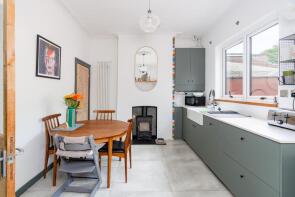
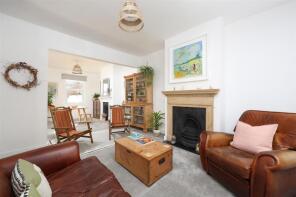
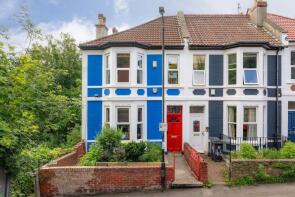
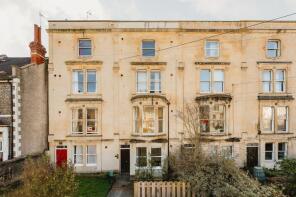
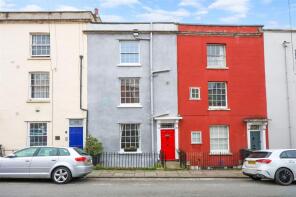
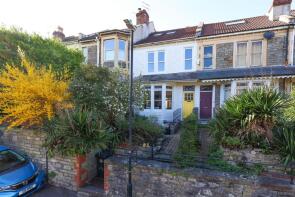
The majority of properties sold in Montpelier during the last year were terraced properties, selling for an average price of £556,818. Flats sold for an average of £270,147, with semi-detached properties fetching £736,250.
Overall, the historical sold prices in Montpelier over the last year were 8% up on the previous year and 3% up on the 2021 peak of £452,814.
Properties Sold
85, York Road, Montpelier, Bristol BS6 5QD
| Today | See what it's worth now |
| 30 Mar 2026 | £650,000 |
| 19 Mar 2020 | £455,000 |
37, Shaftesbury Avenue, Montpelier, Bristol BS6 5LT
| Today | See what it's worth now |
| 27 Mar 2026 | £177,930 |
| 9 Feb 1998 | £64,950 |
No other historical records.
14, West Grove, Montpelier, Bristol BS6 5LS
| Today | See what it's worth now |
| 5 Mar 2026 | £417,500 |
| 16 Feb 2024 | £328,000 |
No other historical records.
148, St Andrews Road, Montpelier, Bristol BS6 5EL
| Today | See what it's worth now |
| 4 Mar 2026 | £597,500 |
| 29 May 2002 | £175,000 |
No other historical records.
Flat C, 68, Ashley Road, Montpelier, Bristol BS6 5NT
| Today | See what it's worth now |
| 24 Feb 2026 | £200,000 |
| 23 Sep 2016 | £90,000 |
Garden Flat, 119, Cromwell Road, Montpelier, Bristol BS6 5EX
| Today | See what it's worth now |
| 13 Feb 2026 | £427,000 |
| 21 Dec 2020 | £364,000 |
Basement Flat, 13, Albany Road, Montpelier, Bristol BS6 5LQ
| Today | See what it's worth now |
| 13 Feb 2026 | £347,000 |
No other historical records.
17, York Road, Montpelier, Bristol BS6 5QB
| Today | See what it's worth now |
| 11 Feb 2026 | £540,000 |
No other historical records.
31, Richmond Road, Montpelier, Bristol BS6 5EN
| Today | See what it's worth now |
| 6 Feb 2026 | £484,000 |
No other historical records.
Flat 7, 24 Rennisons Yard, Picton Lane, Montpelier, Bristol BS6 5EB
| Today | See what it's worth now |
| 6 Feb 2026 | £335,000 |
| 18 Aug 2022 | £285,000 |
No other historical records.
5, Brook Road, Montpelier, Bristol BS6 5LR
| Today | See what it's worth now |
| 14 Jan 2026 | £500,000 |
| 26 Jul 2016 | £346,000 |
516, Armidale Place, Montpelier, Bristol BS6 5DA
| Today | See what it's worth now |
| 14 Jan 2026 | £172,000 |
| 12 Feb 2015 | £137,000 |
Flat E, 68, Ashley Road, Montpelier, Bristol BS6 5NT
| Today | See what it's worth now |
| 13 Jan 2026 | £112,500 |
| 4 May 2018 | £97,000 |
96, York Road, Montpelier, Bristol BS6 5QQ
| Today | See what it's worth now |
| 19 Dec 2025 | £485,000 |
| 26 Nov 2004 | £165,000 |
No other historical records.
116, York Road, Montpelier, Bristol BS6 5QQ
| Today | See what it's worth now |
| 16 Dec 2025 | £860,000 |
| 14 Sep 2012 | £465,000 |
No other historical records.
24, York Road, Montpelier, Bristol BS6 5QE
| Today | See what it's worth now |
| 16 Dec 2025 | £660,000 |
| 29 Oct 1999 | £190,000 |
No other historical records.
44, Picton Lane, Montpelier, Bristol BS6 5PX

| Today | See what it's worth now |
| 16 Dec 2025 | £525,000 |
| 30 Sep 2002 | £185,000 |
No other historical records.
12, Montpelier Court, Station Road, Montpelier, Bristol BS6 5EA
| Today | See what it's worth now |
| 8 Dec 2025 | £265,000 |
| 21 Feb 2020 | £253,000 |
74, Cobourg Road, Montpelier, Bristol BS6 5HX
| Today | See what it's worth now |
| 5 Dec 2025 | £615,000 |
| 1 Mar 2001 | £151,000 |
9, Cobourg Road, Montpelier, Bristol BS6 5HT
| Today | See what it's worth now |
| 19 Nov 2025 | £706,000 |
| 30 Oct 2012 | £440,000 |
Flat 1, 11, Bath Buildings, Montpelier, Bristol BS6 5PT
| Today | See what it's worth now |
| 14 Nov 2025 | £220,000 |
| 23 Feb 2024 | £150,000 |
No other historical records.
Flat B, 68, Ashley Road, Montpelier, Bristol BS6 5NT

| Today | See what it's worth now |
| 14 Nov 2025 | £108,000 |
| 11 May 2018 | £100,000 |
137, Lower Cheltenham Place, Montpelier, Bristol BS6 5LB

| Today | See what it's worth now |
| 13 Nov 2025 | £515,000 |
| 26 Feb 2015 | £289,950 |

Source Acknowledgement: © Crown copyright. England and Wales house price data is publicly available information produced by the HM Land Registry.This material was last updated on 9 July 2026. It covers the period from 1 January 1995 to 30 April 2026 and contains property transactions which have been registered during that period. Contains HM Land Registry data © Crown copyright and database right 2026. This data is licensed under the Open Government Licence v3.0.
Disclaimer: Rightmove.co.uk provides this HM Land Registry data "as is". The burden for fitness of the data relies completely with the user and is provided for informational purposes only. No warranty, express or implied, is given relating to the accuracy of content of the HM Land Registry data and Rightmove does not accept any liability for error or omission. If you have found an error with the data or need further information please contact HM Land Registry.
Permitted Use: Viewers of this Information are granted permission to access this Crown copyright material and to download it onto electronic, magnetic, optical or similar storage media provided that such activities are for private research, study or in-house use only. Any other use of the material requires the formal written permission of Land Registry which can be requested from us, and is subject to an additional licence and associated charge.
Rightmove takes no liability for your use of, or reliance on, Rightmove's Instant Valuation due to the limitations of our tracking tool listed here. Use of this tool is taken entirely at your own risk. All rights reserved.