
House Prices in Norchard
House prices in Norchard have an overall average of £270,280 over the last year.
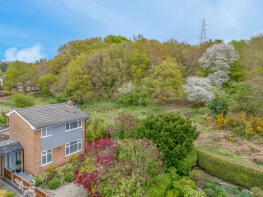
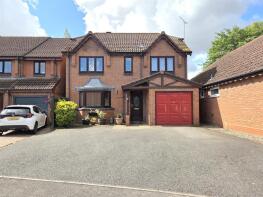
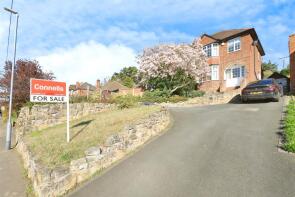
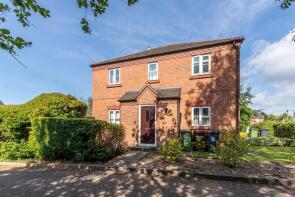
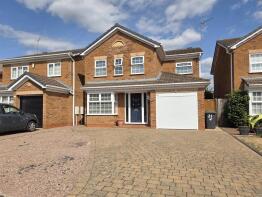
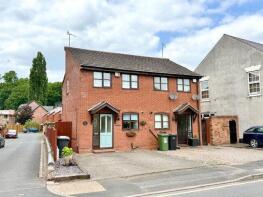
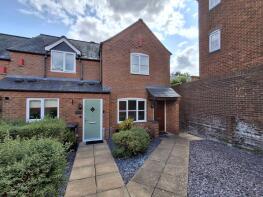
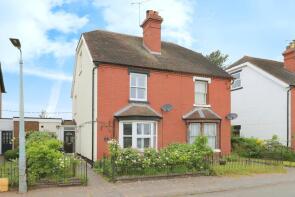
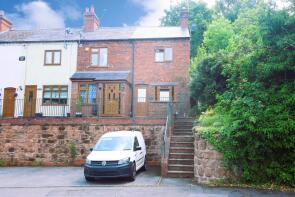
The majority of properties sold in Norchard during the last year were detached properties, selling for an average price of £391,322. Semi-detached properties sold for an average of £246,223, with terraced properties fetching £196,972.
Overall, the historical sold prices in Norchard over the last year were 2% up on the previous year and 4% up on the 2023 peak of £260,158.
Properties Sold
Flat 2, Severn View, Larch Way, Stourport-on-severn DY13 9FE
| Today | See what it's worth now |
| 5 Mar 2026 | £167,500 |
| 28 Jul 2010 | £161,500 |
No other historical records.
53, Mill Road, Stourport-on-severn DY13 9BJ
| Today | See what it's worth now |
| 27 Feb 2026 | £246,000 |
| 29 Sep 2020 | £182,000 |
4, The Spinney, Stourport-on-severn DY13 9GL
| Today | See what it's worth now |
| 27 Feb 2026 | £430,000 |
| 23 Sep 2005 | £273,000 |
No other historical records.
41, Evergreen Way, Stourport-on-severn DY13 9GH
| Today | See what it's worth now |
| 27 Feb 2026 | £525,000 |
| 15 Dec 2006 | £334,995 |
No other historical records.
61, The Grove, Stourport-on-severn DY13 9ND
| Today | See what it's worth now |
| 27 Feb 2026 | £390,000 |
| 29 Jun 2021 | £266,500 |
No other historical records.
42, Longboat Lane, Stourport-on-severn DY13 8AE
| Today | See what it's worth now |
| 4 Feb 2026 | £320,000 |
| 13 Sep 1999 | £90,000 |
No other historical records.
10, Waterfront View, Stourport-on-severn DY13 9BT
| Today | See what it's worth now |
| 2 Feb 2026 | £133,000 |
| 26 Jun 2015 | £112,000 |
Flat 16, Severn View, Larch Way, Stourport-on-severn DY13 9FE
| Today | See what it's worth now |
| 2 Feb 2026 | £178,000 |
| 16 Oct 2019 | £142,000 |
16, Wilden Lane, Stourport-on-severn DY13 9LR
| Today | See what it's worth now |
| 23 Jan 2026 | £285,000 |
| 7 Apr 2017 | £216,000 |
18, Mill Road, Stourport-on-severn DY13 9BG
| Today | See what it's worth now |
| 22 Jan 2026 | £185,000 |
| 20 Dec 2013 | £133,500 |
5, Santa Maria Way, Stourport-on-severn DY13 9RX
| Today | See what it's worth now |
| 20 Jan 2026 | £342,000 |
| 10 Jun 2022 | £333,000 |
21, Santa Maria Way, Stourport-on-severn DY13 9RX
| Today | See what it's worth now |
| 16 Jan 2026 | £350,000 |
| 23 Sep 2021 | £310,000 |
No other historical records.
33a Brooklands, Baldwin Road, Stourport-on-severn DY13 9AZ
| Today | See what it's worth now |
| 16 Jan 2026 | £175,000 |
| 18 Dec 2009 | £142,500 |
4, Conifer Place, Stourport-on-severn DY13 9GR
| Today | See what it's worth now |
| 16 Jan 2026 | £135,000 |
| 31 Aug 2016 | £118,000 |
43, The Slad, Stourport-on-severn DY13 9JW
| Today | See what it's worth now |
| 19 Dec 2025 | £220,000 |
| 29 Apr 2021 | £171,000 |
Flat 17, Severn View, Larch Way, Stourport-on-severn DY13 9FE
| Today | See what it's worth now |
| 19 Dec 2025 | £180,000 |
| 29 Sep 2017 | £155,000 |
12, Millfields Court, Timberland Way, Stourport-on-severn DY13 9GP
| Today | See what it's worth now |
| 16 Dec 2025 | £139,500 |
| 24 Feb 2006 | £143,950 |
No other historical records.
17, Lodge Cottages, Stourport-on-severn DY13 9BW
| Today | See what it's worth now |
| 12 Dec 2025 | £187,500 |
| 29 Aug 2002 | £89,950 |
No other historical records.
5, Wilden Top Road, Stourport-on-severn DY13 9JF
| Today | See what it's worth now |
| 5 Dec 2025 | £385,000 |
| 28 Aug 2015 | £170,000 |
No other historical records.
58, Prospect Road, Stourport On Severn DY13 9DE

| Today | See what it's worth now |
| 4 Dec 2025 | £155,000 |
No other historical records.
6, Conifer Place, Stourport-on-severn DY13 9GR
| Today | See what it's worth now |
| 28 Nov 2025 | £140,000 |
| 25 Mar 2022 | £133,000 |
15, Manor Close, Stourport-on-severn DY13 9DR

| Today | See what it's worth now |
| 28 Nov 2025 | £210,000 |
| 15 Feb 2024 | £145,000 |
No other historical records.
7, The Osiers, Stourport-on-severn DY13 9GB

| Today | See what it's worth now |
| 26 Nov 2025 | £150,000 |
| 22 Oct 2004 | £142,995 |
No other historical records.
82, Wilden Lane, Stourport-on-severn DY13 9LR
| Today | See what it's worth now |
| 21 Nov 2025 | £217,000 |
| 9 Nov 2018 | £165,000 |
Flat 1, River View, Larch Way, Stourport-on-severn DY13 9EJ
| Today | See what it's worth now |
| 17 Nov 2025 | £175,000 |
| 16 May 2014 | £149,500 |
No other historical records.
Source Acknowledgement: © Crown copyright. England and Wales house price data is publicly available information produced by the HM Land Registry.This material was last updated on 15 May 2026. It covers the period from 1 January 1995 to 31 March 2026 and contains property transactions which have been registered during that period. Contains HM Land Registry data © Crown copyright and database right 2026. This data is licensed under the Open Government Licence v3.0.
Disclaimer: Rightmove.co.uk provides this HM Land Registry data "as is". The burden for fitness of the data relies completely with the user and is provided for informational purposes only. No warranty, express or implied, is given relating to the accuracy of content of the HM Land Registry data and Rightmove does not accept any liability for error or omission. If you have found an error with the data or need further information please contact HM Land Registry.
Permitted Use: Viewers of this Information are granted permission to access this Crown copyright material and to download it onto electronic, magnetic, optical or similar storage media provided that such activities are for private research, study or in-house use only. Any other use of the material requires the formal written permission of Land Registry which can be requested from us, and is subject to an additional licence and associated charge.
Map data ©OpenStreetMap contributors.
Rightmove takes no liability for your use of, or reliance on, Rightmove's Instant Valuation due to the limitations of our tracking tool listed here. Use of this tool is taken entirely at your own risk. All rights reserved.