
House Prices in North Burcombe
House prices in North Burcombe have an overall average of £357,180 over the last year.
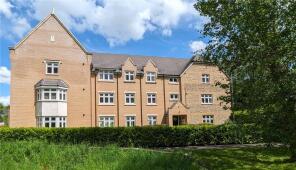
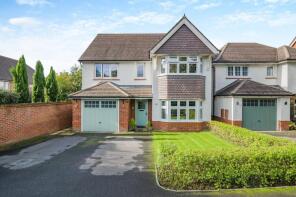
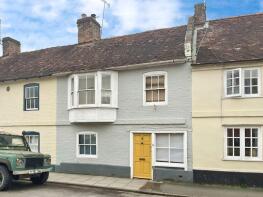
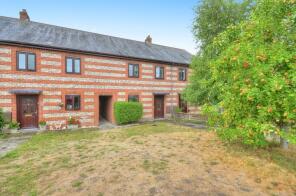
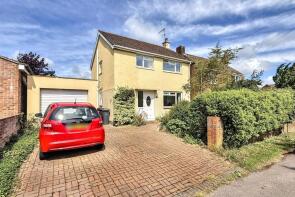
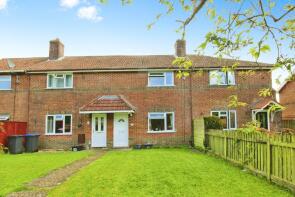
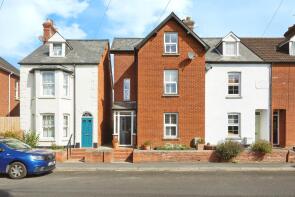
The majority of properties sold in North Burcombe during the last year were terraced properties, selling for an average price of £322,475. Detached properties sold for an average of £510,133, with flats fetching £211,995.
Overall, the historical sold prices in North Burcombe over the last year were 6% up on the previous year and 2% up on the 2023 peak of £351,189.
Properties Sold
5, Northleigh Terrace, Salisbury SP2 0HR

| Today | See what it's worth now |
| 4 Mar 2026 | £228,000 |
| 8 Sep 2025 | £230,000 |
33, Water Ditchampton, Salisbury SP2 0JB

| Today | See what it's worth now |
| 27 Feb 2026 | £465,000 |
| 9 Apr 1999 | £118,000 |
No other historical records.
14 Bulbridge Barns, Bulbridge Farm, Burcombe Lane, Salisbury SP2 0ES
| Today | See what it's worth now |
| 24 Feb 2026 | £348,000 |
| 31 Aug 2016 | £235,000 |
No other historical records.
3, Bailey Lane, Salisbury SP2 0FR
| Today | See what it's worth now |
| 13 Feb 2026 | £350,000 |
| 12 Oct 2015 | £309,950 |
No other historical records.
67, Bailey Lane, Salisbury SP2 0FR
| Today | See what it's worth now |
| 29 Jan 2026 | £382,500 |
| 23 Sep 2016 | £359,950 |
No other historical records.
5, Pembroke Court, West Street, Salisbury SP2 0DG
| Today | See what it's worth now |
| 16 Jan 2026 | £145,000 |
| 23 Sep 2015 | £169,950 |
Ducks Walk Cottage, Russell Street, Wilton SP2 0BG
| Today | See what it's worth now |
| 19 Dec 2025 | £405,000 |
No other historical records.
106, The Hollows, Salisbury SP2 0JE
| Today | See what it's worth now |
| 19 Dec 2025 | £280,000 |
| 12 Aug 2013 | £187,500 |
Apartment 3, Olivier Place, Hart Close, Salisbury SP2 0FW
| Today | See what it's worth now |
| 16 Dec 2025 | £182,500 |
| 15 Aug 2017 | £242,100 |
No other historical records.
36, Riverside, Salisbury SP2 0HW
| Today | See what it's worth now |
| 12 Dec 2025 | £265,000 |
| 6 Jul 2020 | £170,000 |
No other historical records.
10, St Ediths Close, Wilton SP2 0LU
| Today | See what it's worth now |
| 12 Dec 2025 | £429,500 |
No other historical records.
1 Corner Cottage, Russell Street, Salisbury SP2 0BG
| Today | See what it's worth now |
| 12 Dec 2025 | £620,000 |
| 1 Jul 2019 | £350,000 |
No other historical records.
85, Bailey Lane, Salisbury SP2 0FR
| Today | See what it's worth now |
| 12 Dec 2025 | £185,000 |
| 19 Aug 2016 | £184,950 |
No other historical records.
24, Oakley Road, Salisbury SP2 0FA
| Today | See what it's worth now |
| 5 Dec 2025 | £585,000 |
| 25 Jan 2017 | £434,950 |
No other historical records.
3, Wiley Terrace, Salisbury SP2 0HN

| Today | See what it's worth now |
| 28 Nov 2025 | £310,000 |
| 26 Apr 2013 | £187,000 |
No other historical records.
71, North Street, Salisbury SP2 0HH
| Today | See what it's worth now |
| 24 Nov 2025 | £377,500 |
| 23 Mar 2020 | £360,000 |
6, Ashleigh Close, Salisbury SP2 0RD
| Today | See what it's worth now |
| 24 Nov 2025 | £295,000 |
| 8 Jan 2009 | £197,000 |
No other historical records.
55, Randalls Croft Road, Salisbury SP2 0EY

| Today | See what it's worth now |
| 20 Nov 2025 | £124,950 |
| 30 Apr 2007 | £116,000 |
15, Chantry Road, Salisbury SP2 0LT
| Today | See what it's worth now |
| 19 Nov 2025 | £410,000 |
| 29 Jan 2008 | £307,000 |
58, The Hollows, Salisbury SP2 0JE
| Today | See what it's worth now |
| 17 Nov 2025 | £272,500 |
| 30 Jul 2021 | £227,000 |
32, Shaftesbury Road, Salisbury SP2 0DR
| Today | See what it's worth now |
| 14 Nov 2025 | £375,000 |
| 27 May 2016 | £270,000 |
No other historical records.
26, Oakley Road, Salisbury SP2 0FA
| Today | See what it's worth now |
| 14 Nov 2025 | £600,000 |
| 7 Apr 2017 | £434,950 |
No other historical records.
71, Bulbridge Road, Wilton SP2 0LE
| Today | See what it's worth now |
| 11 Nov 2025 | £415,000 |
No other historical records.
Source Acknowledgement: © Crown copyright. England and Wales house price data is publicly available information produced by the HM Land Registry.This material was last updated on 15 May 2026. It covers the period from 1 January 1995 to 31 March 2026 and contains property transactions which have been registered during that period. Contains HM Land Registry data © Crown copyright and database right 2026. This data is licensed under the Open Government Licence v3.0.
Disclaimer: Rightmove.co.uk provides this HM Land Registry data "as is". The burden for fitness of the data relies completely with the user and is provided for informational purposes only. No warranty, express or implied, is given relating to the accuracy of content of the HM Land Registry data and Rightmove does not accept any liability for error or omission. If you have found an error with the data or need further information please contact HM Land Registry.
Permitted Use: Viewers of this Information are granted permission to access this Crown copyright material and to download it onto electronic, magnetic, optical or similar storage media provided that such activities are for private research, study or in-house use only. Any other use of the material requires the formal written permission of Land Registry which can be requested from us, and is subject to an additional licence and associated charge.
Map data ©OpenStreetMap contributors.
Rightmove takes no liability for your use of, or reliance on, Rightmove's Instant Valuation due to the limitations of our tracking tool listed here. Use of this tool is taken entirely at your own risk. All rights reserved.