
House Prices in North Chailey
House prices in North Chailey have an overall average of £639,333 over the last year.
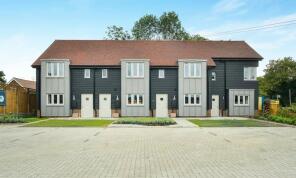
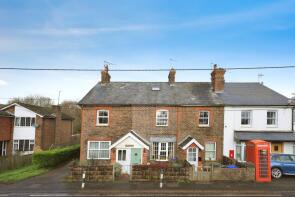
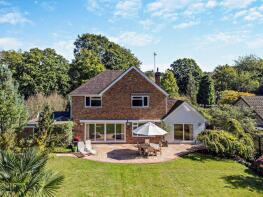
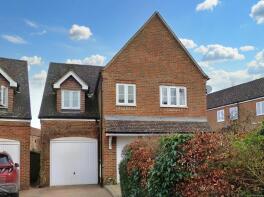
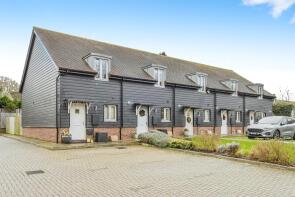
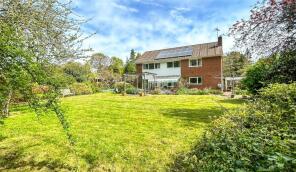
The majority of properties sold in North Chailey during the last year were semi-detached properties, selling for an average price of £561,300. Detached properties sold for an average of £1,189,375, with terraced properties fetching £494,000.
Overall, the historical sold prices in North Chailey over the last year were similar to the previous year and 13% down on the 2022 peak of £734,192.
Properties Sold
1, Hillbrow, Haywards Heath Road, Lewes BN8 4EX
| Today | See what it's worth now |
| 9 Dec 2025 | £440,000 |
| 28 Jun 2021 | £455,000 |
No other historical records.
The Old Coach House, Roeheath, Cinder Hill, North Chailey, Chailey BN8 4HR
| Today | See what it's worth now |
| 26 Nov 2025 | £1,035,000 |
| 27 Nov 1996 | £190,000 |
No other historical records.
1, Bineham Lodge, East Grinstead Road, Lewes BN8 4DD
| Today | See what it's worth now |
| 4 Nov 2025 | £451,500 |
| 30 Sep 2022 | £435,000 |
4, New Heritage Way, Lewes BN8 4GD
| Today | See what it's worth now |
| 10 Oct 2025 | £710,000 |
| 29 Jan 2016 | £490,000 |
No other historical records.
Northwood, Lower Station Road, Lewes BN8 4HT
| Today | See what it's worth now |
| 10 Oct 2025 | £807,500 |
| 5 Jun 2020 | £700,000 |
No other historical records.
Flat 1, 37, New Heritage Way, Lewes BN8 4GF
| Today | See what it's worth now |
| 6 Oct 2025 | £104,000 |
| 3 Apr 2009 | £49,500 |
No other historical records.
2, Yew Tree Cottages, Haywards Heath Road, Lewes BN8 4EU
| Today | See what it's worth now |
| 26 Sep 2025 | £425,000 |
| 10 Feb 2017 | £400,000 |
2, Kings Meadow, Lewes BN8 4AA
| Today | See what it's worth now |
| 28 Aug 2025 | £220,000 |
| 11 Jan 2019 | £195,000 |
No other historical records.
The Chapel, St Georges, Mill Lane, North Chailey BN8 4EG

| Today | See what it's worth now |
| 24 Jul 2025 | £772,000 |
| 23 Oct 1998 | £220,000 |
No other historical records.
Cinderfield House, Cornwell's Bank, Lewes BN8 4RH
| Today | See what it's worth now |
| 23 Jul 2025 | £1,815,000 |
| 27 Jul 2020 | £975,000 |
No other historical records.
2, Roussillon Cottages, Cinder Hill, North Chailey, Chailey BN8 4HP
| Today | See what it's worth now |
| 11 Jul 2025 | £780,000 |
No other historical records.
12, Kings Meadow, Lewes BN8 4AA
| Today | See what it's worth now |
| 11 Jul 2025 | £350,000 |
| 7 Feb 2020 | £325,000 |
No other historical records.
Flat 4, Crossways, Haywards Heath Road, North Chailey BN8 4ET
| Today | See what it's worth now |
| 10 Jul 2025 | £220,000 |
No other historical records.
2, South View, Haywards Heath Road, Lewes BN8 4EY
| Today | See what it's worth now |
| 7 Jul 2025 | £360,000 |
| 22 Jun 2021 | £230,000 |
No other historical records.
Stroudley, Lower Station Road, Lewes BN8 4HU
| Today | See what it's worth now |
| 4 Jul 2025 | £1,100,000 |
| 12 Aug 2015 | £840,000 |
1, The Red House, Warrs Hill Road, Lewes BN8 4JE
| Today | See what it's worth now |
| 23 Jun 2025 | £308,000 |
| 26 Mar 2024 | £285,000 |
Grantham Cottage, Haywards Heath Road, Lewes BN8 4DS
| Today | See what it's worth now |
| 29 Apr 2025 | £528,500 |
| 27 Nov 1998 | £163,500 |
No other historical records.
2, Grammar Court St Georges, Mill Lane, Lewes BN8 4EG
| Today | See what it's worth now |
| 31 Mar 2025 | £467,500 |
| 7 Jun 2007 | £360,000 |
Holford Lodge, Haywards Heath Road, North Chailey BN8 4DT
| Today | See what it's worth now |
| 26 Mar 2025 | £769,000 |
No other historical records.
5, Kings Meadow, Lewes BN8 4AA
| Today | See what it's worth now |
| 21 Feb 2025 | £365,000 |
| 12 Jul 2019 | £315,000 |
No other historical records.
3, New Heritage Way, Lewes BN8 4GD

| Today | See what it's worth now |
| 21 Feb 2025 | £780,000 |
| 7 Aug 2015 | £625,000 |
No other historical records.
44, New Heritage Way, Lewes BN8 4GD
| Today | See what it's worth now |
| 18 Feb 2025 | £530,000 |
| 17 Sep 2010 | £295,000 |
No other historical records.
6, Kings Meadow, Lewes BN8 4AA
| Today | See what it's worth now |
| 10 Jan 2025 | £348,000 |
| 29 Mar 2019 | £300,000 |
No other historical records.

Source Acknowledgement: © Crown copyright. England and Wales house price data is publicly available information produced by the HM Land Registry.This material was last updated on 9 July 2026. It covers the period from 1 January 1995 to 30 April 2026 and contains property transactions which have been registered during that period. Contains HM Land Registry data © Crown copyright and database right 2026. This data is licensed under the Open Government Licence v3.0.
Disclaimer: Rightmove.co.uk provides this HM Land Registry data "as is". The burden for fitness of the data relies completely with the user and is provided for informational purposes only. No warranty, express or implied, is given relating to the accuracy of content of the HM Land Registry data and Rightmove does not accept any liability for error or omission. If you have found an error with the data or need further information please contact HM Land Registry.
Permitted Use: Viewers of this Information are granted permission to access this Crown copyright material and to download it onto electronic, magnetic, optical or similar storage media provided that such activities are for private research, study or in-house use only. Any other use of the material requires the formal written permission of Land Registry which can be requested from us, and is subject to an additional licence and associated charge.
Rightmove takes no liability for your use of, or reliance on, Rightmove's Instant Valuation due to the limitations of our tracking tool listed here. Use of this tool is taken entirely at your own risk. All rights reserved.