
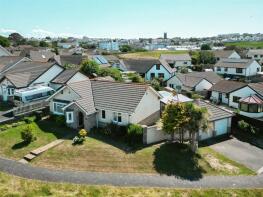
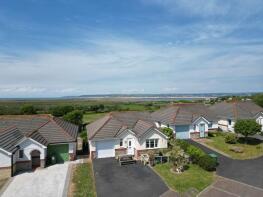
House Prices in Northam
House prices in Northam have an overall average of £346,057 over the last year.
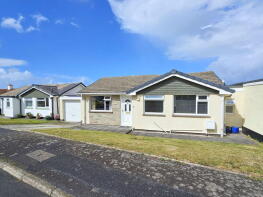
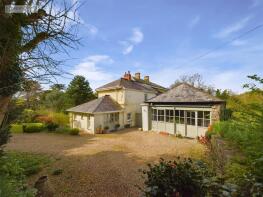
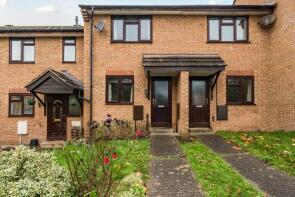
The majority of properties sold in Northam during the last year were detached properties, selling for an average price of £442,202. Terraced properties sold for an average of £213,125, with semi-detached properties fetching £336,583.
Overall, the historical sold prices in Northam over the last year were 9% down on the previous year and 8% down on the 2023 peak of £374,200.
Properties Sold
12, Castle Street, Bideford EX39 1AT
| Today | See what it's worth now |
| 15 Apr 2026 | £206,000 |
| 21 Feb 2023 | £110,500 |
No other historical records.
17, Dane Court, Bideford EX39 1UA
| Today | See what it's worth now |
| 10 Apr 2026 | £190,000 |
| 4 Mar 2016 | £152,000 |
12, J.h.taylor Drive, Bideford EX39 1TU
| Today | See what it's worth now |
| 2 Apr 2026 | £425,000 |
| 23 Apr 2003 | £199,950 |
7, Lilybridge, Bideford EX39 1TL
| Today | See what it's worth now |
| 20 Mar 2026 | £130,000 |
| 23 Mar 2022 | £120,000 |
30, Estuary View, Bideford EX39 1XZ
| Today | See what it's worth now |
| 5 Mar 2026 | £360,000 |
| 19 Jun 1998 | £98,500 |
8, Richmond Park, Bideford EX39 1ER
| Today | See what it's worth now |
| 2 Mar 2026 | £380,000 |
| 2 Jul 2018 | £259,950 |
The Old Courtyard, Limers Lane, Bideford EX39 2RG
| Today | See what it's worth now |
| 13 Feb 2026 | £630,000 |
| 31 Jan 2012 | £368,750 |
18, Hanson Park, Bideford EX39 3SA
| Today | See what it's worth now |
| 11 Feb 2026 | £157,500 |
| 30 Sep 2013 | £110,000 |
The Posting House, Honey Street, Bideford EX39 1DL
| Today | See what it's worth now |
| 9 Feb 2026 | £515,000 |
| 1 Dec 2022 | £406,000 |
7, Appletree Gardens, Bideford EX39 3SL
| Today | See what it's worth now |
| 2 Feb 2026 | £323,000 |
| 30 Sep 2010 | £212,000 |
No other historical records.
4, Hanson Park, Bideford EX39 3SA
| Today | See what it's worth now |
| 29 Jan 2026 | £245,000 |
| 15 Jun 2009 | £137,600 |
No other historical records.
66, Kimberley Park, Bideford EX39 1GG
| Today | See what it's worth now |
| 28 Jan 2026 | £170,000 |
| 24 Jan 2014 | £138,000 |
Lark Rise, Daddon Hill, Bideford EX39 3PW
| Today | See what it's worth now |
| 28 Jan 2026 | £600,000 |
| 4 May 2018 | £460,000 |
5, North East Street, Bideford EX39 1DJ
| Today | See what it's worth now |
| 28 Jan 2026 | £160,000 |
| 16 Mar 2012 | £125,000 |
1, Kimberley Park, Bideford EX39 1GQ
| Today | See what it's worth now |
| 19 Jan 2026 | £310,000 |
| 31 May 2023 | £325,000 |
17, Tudor Close, Bideford EX39 3QD
| Today | See what it's worth now |
| 15 Jan 2026 | £535,000 |
| 18 Nov 2013 | £378,000 |
3, Alexandra Terrace, Diddywell Road, Bideford EX39 1EE
| Today | See what it's worth now |
| 7 Jan 2026 | £160,000 |
| 21 Apr 1995 | £44,000 |
No other historical records.
Leigh Cottage, Burrough Road, Northam EX39 1BU
| Today | See what it's worth now |
| 19 Dec 2025 | £200,000 |
| 21 Aug 2017 | £153,000 |
6, Estuary View, Bideford EX39 1XZ
| Today | See what it's worth now |
| 19 Dec 2025 | £415,000 |
| 14 Aug 1997 | £89,500 |
No other historical records.
9, Green Gardens, Bideford EX39 3QG
| Today | See what it's worth now |
| 16 Dec 2025 | £525,000 |
| 15 Oct 2008 | £295,000 |
2, West Moor Close, Bideford EX39 1SR
| Today | See what it's worth now |
| 10 Dec 2025 | £275,000 |
| 23 Sep 1997 | £60,000 |
No other historical records.
East Gate, Durrant Lane, Northam EX39 2RL
| Today | See what it's worth now |
| 4 Dec 2025 | £525,000 |
No other historical records.
1, Northam House, Heywood Road, Bideford EX39 1AL
| Today | See what it's worth now |
| 25 Nov 2025 | £285,000 |
| 25 Sep 2015 | £228,000 |
Source Acknowledgement: © Crown copyright. England and Wales house price data is publicly available information produced by the HM Land Registry.This material was last updated on 9 July 2026. It covers the period from 1 January 1995 to 30 April 2026 and contains property transactions which have been registered during that period. Contains HM Land Registry data © Crown copyright and database right 2026. This data is licensed under the Open Government Licence v3.0.
Disclaimer: Rightmove.co.uk provides this HM Land Registry data "as is". The burden for fitness of the data relies completely with the user and is provided for informational purposes only. No warranty, express or implied, is given relating to the accuracy of content of the HM Land Registry data and Rightmove does not accept any liability for error or omission. If you have found an error with the data or need further information please contact HM Land Registry.
Permitted Use: Viewers of this Information are granted permission to access this Crown copyright material and to download it onto electronic, magnetic, optical or similar storage media provided that such activities are for private research, study or in-house use only. Any other use of the material requires the formal written permission of Land Registry which can be requested from us, and is subject to an additional licence and associated charge.
Rightmove takes no liability for your use of, or reliance on, Rightmove's Instant Valuation due to the limitations of our tracking tool listed here. Use of this tool is taken entirely at your own risk. All rights reserved.