
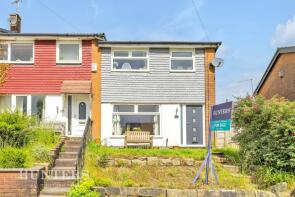
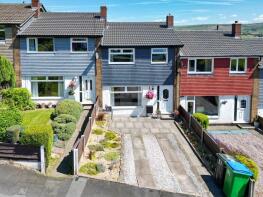
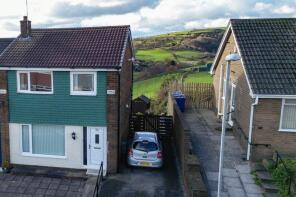
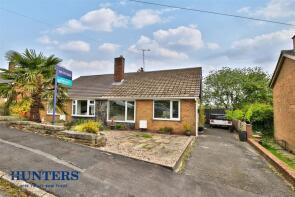
House Prices in Shore Mount, Littleborough, Rochdale, OL15
House prices in Shore Mount have an overall average of £197,500 over the last year.
Overall, the historical sold prices in Shore Mount over the last year were 2% up on the previous year and similar to the 2022 peak of £195,667.
Properties Sold
69, Shore Mount, Littleborough OL15 8EW
| Today | See what it's worth now |
| 22 Nov 2024 | £190,000 |
| 21 Mar 2014 | £107,000 |
No other historical records.
91, Shore Mount, Littleborough OL15 8EW
| Today | See what it's worth now |
| 22 Nov 2024 | £205,000 |
| 27 Oct 1995 | £40,000 |
No other historical records.
53, Shore Mount, Littleborough OL15 8EW
| Today | See what it's worth now |
| 2 Apr 2024 | £182,500 |
No other historical records.
19, Shore Mount, Littleborough OL15 8EN
| Today | See what it's worth now |
| 16 Nov 2023 | £220,000 |
| 14 Nov 2005 | £120,000 |
12, Shore Mount, Littleborough OL15 8EN
| Today | See what it's worth now |
| 18 Oct 2023 | £190,000 |
| 9 Dec 2016 | £124,950 |
35, Shore Mount, Littleborough OL15 8EN
| Today | See what it's worth now |
| 1 Sep 2023 | £161,500 |
| 21 Jun 1996 | £45,000 |
No other historical records.
4, Shore Mount, Littleborough OL15 8EN
| Today | See what it's worth now |
| 24 Jul 2023 | £210,000 |
| 20 Aug 2021 | £154,000 |
No other historical records.
85, Shore Mount, Littleborough OL15 8EW
| Today | See what it's worth now |
| 2 Nov 2022 | £222,000 |
| 17 Aug 2018 | £158,000 |
40, Shore Mount, Littleborough OL15 8EW
| Today | See what it's worth now |
| 31 Mar 2022 | £180,000 |
| 18 Dec 2015 | £121,750 |
1, Shore Mount, Littleborough OL15 8EN
| Today | See what it's worth now |
| 25 Feb 2022 | £185,000 |
| 20 Jul 2020 | £155,000 |
22, Shore Mount, Littleborough OL15 8EN
| Today | See what it's worth now |
| 2 Dec 2021 | £183,000 |
| 29 Jun 2012 | £113,000 |
46, Shore Mount, Littleborough OL15 8EW
| Today | See what it's worth now |
| 26 Nov 2021 | £170,000 |
| 12 Dec 2002 | £75,000 |
32, Shore Mount, Littleborough OL15 8EW
| Today | See what it's worth now |
| 18 Aug 2021 | £186,000 |
| 28 Nov 2013 | £120,000 |
61, Shore Mount, Littleborough OL15 8EW


| Today | See what it's worth now |
| 17 Dec 2020 | £135,000 |
| 5 Dec 1997 | £58,000 |
No other historical records.
38, Shore Mount, Littleborough OL15 8EW
| Today | See what it's worth now |
| 10 Sep 2020 | £100,000 |
No other historical records.
31, Shore Mount, Littleborough OL15 8EN
| Today | See what it's worth now |
| 24 Feb 2020 | £184,500 |
| 17 Jun 2016 | £133,000 |
No other historical records.
18, Shore Mount, Littleborough OL15 8EN
| Today | See what it's worth now |
| 14 Feb 2020 | £165,000 |
| 17 Jun 2016 | £120,000 |
65, Shore Mount, Littleborough OL15 8EW
| Today | See what it's worth now |
| 9 Oct 2019 | £153,000 |
No other historical records.
47, Shore Mount, Littleborough OL15 8EW
| Today | See what it's worth now |
| 11 Jan 2019 | £167,000 |
| 17 Mar 2006 | £131,000 |
93, Shore Mount, Littleborough OL15 8EW
| Today | See what it's worth now |
| 4 Jan 2019 | £137,500 |
| 18 Feb 2005 | £104,000 |
45, Shore Mount, Littleborough OL15 8EN
| Today | See what it's worth now |
| 2 Feb 2018 | £124,000 |
No other historical records.
57, Shore Mount, Littleborough OL15 8EW
| Today | See what it's worth now |
| 15 Dec 2017 | £158,000 |
| 21 Oct 2005 | £167,500 |
25, Shore Mount, Littleborough OL15 8EN
| Today | See what it's worth now |
| 18 Aug 2017 | £138,000 |
| 14 Jul 2016 | £83,000 |
No other historical records.
8, Shore Mount, Littleborough OL15 8EN
| Today | See what it's worth now |
| 11 Aug 2017 | £129,995 |
| 30 Jun 2015 | £110,000 |
No other historical records.
20, Shore Mount, Littleborough OL15 8EN
| Today | See what it's worth now |
| 11 Jul 2017 | £129,950 |
| 20 Dec 2007 | £134,000 |
Find out how much your property is worth
The following agents can provide you with a free, no-obligation valuation. Simply select the ones you'd like to hear from.
Sponsored
All featured agents have paid a fee to promote their valuation expertise.

Hunters
Littleborough and Surrounding Areas

Ryder & Dutton
Rochdale

Face to Face Estate Agents
Littleborough

Dalesway North
Todmorden and Surrounding

Revilo Homes
Rochdale

Andrew Kelly
Littleborough and Surrounding
Get ready with a Mortgage in Principle
- Personalised result in just 20 minutes
- Find out how much you can borrow
- Get viewings faster with agents
- No impact on your credit score
What's your property worth?
House prices near Shore Mount
Source Acknowledgement: © Crown copyright. England and Wales house price data is publicly available information produced by the HM Land Registry.This material was last updated on 16 July 2025. It covers the period from 1 January 1995 to 30 May 2025 and contains property transactions which have been registered during that period. Contains HM Land Registry data © Crown copyright and database right 2025. This data is licensed under the Open Government Licence v3.0.
Disclaimer: Rightmove.co.uk provides this HM Land Registry data "as is". The burden for fitness of the data relies completely with the user and is provided for informational purposes only. No warranty, express or implied, is given relating to the accuracy of content of the HM Land Registry data and Rightmove does not accept any liability for error or omission. If you have found an error with the data or need further information please contact HM Land Registry.
Permitted Use: Viewers of this Information are granted permission to access this Crown copyright material and to download it onto electronic, magnetic, optical or similar storage media provided that such activities are for private research, study or in-house use only. Any other use of the material requires the formal written permission of Land Registry which can be requested from us, and is subject to an additional licence and associated charge.
Data on planning applications, home extensions and build costs is provided by Resi.co.uk. Planning data is calculated using the last 2 years of residential applications within the selected planning authority. Home extension data, such as build costs and project timelines, are calculated using approximately 9,000 architectural projects Resi has completed, and 23,500 builders quotes submitted via Resi's platform. Build costs are adjusted according to inflation rates to more accurately represent today's prices.
Map data ©OpenStreetMap contributors.
Rightmove takes no liability for your use of, or reliance on, Rightmove's Instant Valuation due to the limitations of our tracking tool listed here. Use of this tool is taken entirely at your own risk. All rights reserved.