
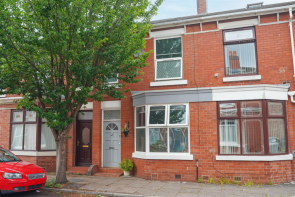
House Prices in Old Trafford
House prices in Old Trafford have an overall average of £313,561 over the last year.
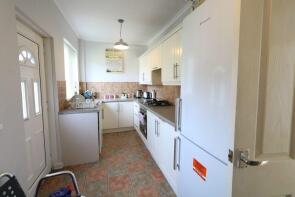
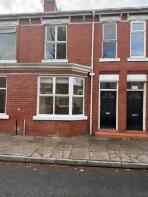
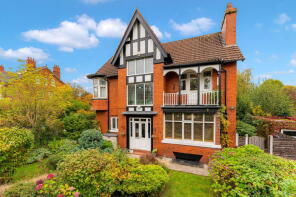
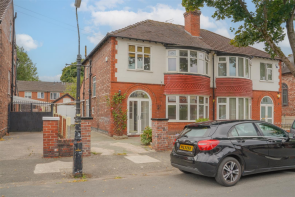
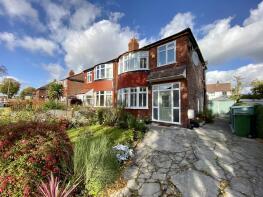
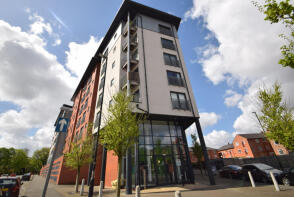
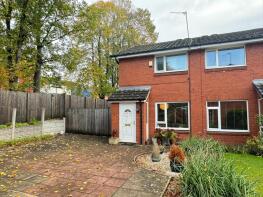
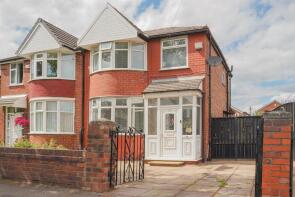
The majority of properties sold in Old Trafford during the last year were terraced properties, selling for an average price of £290,500. Semi-detached properties sold for an average of £408,840, with flats fetching £163,936.
Overall, the historical sold prices in Old Trafford over the last year were 2% down on the previous year and 15% up on the 2022 peak of £272,833.
Properties Sold
3, Worthington Street, Old Trafford M16 9LB
| Today | See what it's worth now |
| 17 Apr 2026 | £165,000 |
No other historical records.
31, Premier Street, Manchester M16 9WB

| Today | See what it's worth now |
| 13 Apr 2026 | £210,000 |
| 7 Jul 2020 | £175,000 |
No other historical records.
4, Darley Road, Manchester M16 0DQ

| Today | See what it's worth now |
| 10 Apr 2026 | £658,000 |
| 5 Sep 1997 | £64,000 |
No other historical records.
61, Addison Crescent, Manchester M16 0LZ
| Today | See what it's worth now |
| 25 Mar 2026 | £260,000 |
| 23 Feb 2018 | £210,000 |
15, Khartoum Street, Old Trafford M16 9WE
| Today | See what it's worth now |
| 13 Mar 2026 | £280,000 |
No other historical records.
247, Seymour Grove, Old Trafford M16 0DS
| Today | See what it's worth now |
| 10 Mar 2026 | £730,000 |
No other historical records.
2, Wimbledon Close, Manchester M16 9FT
| Today | See what it's worth now |
| 6 Mar 2026 | £460,000 |
| 26 May 2017 | £327,000 |
No other historical records.
12, Ruskin Road, Manchester M16 9GS
| Today | See what it's worth now |
| 27 Feb 2026 | £465,000 |
| 27 Nov 1995 | £53,500 |
No other historical records.
11, Rosslyn Road, Manchester M16 0FY
| Today | See what it's worth now |
| 26 Feb 2026 | £415,000 |
| 23 Oct 2020 | £350,000 |
Apartment 42, 25, Chorlton Street, Manchester M16 9HN
| Today | See what it's worth now |
| 13 Feb 2026 | £110,000 |
| 8 Jun 2018 | £87,000 |
7, Farwood Close, Manchester M16 9DQ
| Today | See what it's worth now |
| 3 Feb 2026 | £255,000 |
| 30 Nov 2017 | £159,999 |
214, Kings Road, Manchester M16 0GR
| Today | See what it's worth now |
| 2 Feb 2026 | £380,000 |
| 23 Aug 1999 | £59,995 |
No other historical records.
4, Khartoum Street, Manchester M16 9WE
| Today | See what it's worth now |
| 30 Jan 2026 | £335,000 |
| 30 Oct 2015 | £199,950 |
21, Blackburn Street, Old Trafford M16 9LJ
| Today | See what it's worth now |
| 30 Jan 2026 | £210,000 |
No other historical records.
26, Prestage Street, Manchester M16 9JU
| Today | See what it's worth now |
| 30 Jan 2026 | £247,500 |
| 19 Feb 2021 | £185,000 |
47, Worthington Street, Manchester M16 9LB
| Today | See what it's worth now |
| 28 Jan 2026 | £252,500 |
| 14 Aug 2020 | £193,500 |
19, Walter Street, Manchester M16 9GB

| Today | See what it's worth now |
| 20 Jan 2026 | £300,000 |
| 30 Jun 2021 | £290,000 |
18, Carlton Street, Manchester M16 7GT

| Today | See what it's worth now |
| 19 Jan 2026 | £355,000 |
| 7 Jan 2021 | £282,500 |
71, 41 Madison Apartments, Seymour Grove, Manchester M16 0NB
| Today | See what it's worth now |
| 16 Jan 2026 | £65,000 |
| 14 Jun 2013 | £55,000 |
38, Worthington Street, Manchester M16 9LA
| Today | See what it's worth now |
| 16 Jan 2026 | £225,000 |
| 20 Jun 2013 | £105,000 |
No other historical records.
11, Lime Grove, Old Trafford M16 0NN
| Today | See what it's worth now |
| 16 Jan 2026 | £330,250 |
No other historical records.
Apartment 304, Urban Green, Seymour Grove, Old Trafford M16 0UP
| Today | See what it's worth now |
| 2 Jan 2026 | £268,673 |
No other historical records.
5, Fulford Street, Manchester M16 9PX
| Today | See what it's worth now |
| 17 Dec 2025 | £340,000 |
| 11 Feb 2011 | £160,000 |
Source Acknowledgement: © Crown copyright. England and Wales house price data is publicly available information produced by the HM Land Registry.This material was last updated on 9 July 2026. It covers the period from 1 January 1995 to 30 April 2026 and contains property transactions which have been registered during that period. Contains HM Land Registry data © Crown copyright and database right 2026. This data is licensed under the Open Government Licence v3.0.
Disclaimer: Rightmove.co.uk provides this HM Land Registry data "as is". The burden for fitness of the data relies completely with the user and is provided for informational purposes only. No warranty, express or implied, is given relating to the accuracy of content of the HM Land Registry data and Rightmove does not accept any liability for error or omission. If you have found an error with the data or need further information please contact HM Land Registry.
Permitted Use: Viewers of this Information are granted permission to access this Crown copyright material and to download it onto electronic, magnetic, optical or similar storage media provided that such activities are for private research, study or in-house use only. Any other use of the material requires the formal written permission of Land Registry which can be requested from us, and is subject to an additional licence and associated charge.
Rightmove takes no liability for your use of, or reliance on, Rightmove's Instant Valuation due to the limitations of our tracking tool listed here. Use of this tool is taken entirely at your own risk. All rights reserved.