
House Prices in Olton
House prices in Olton have an overall average of £312,442 over the last year.
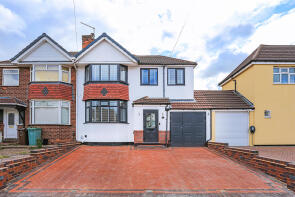
The majority of properties sold in Olton during the last year were semi-detached properties, selling for an average price of £324,247. Terraced properties sold for an average of £296,740, with flats fetching £156,054.
Overall, the historical sold prices in Olton over the last year were similar to the previous year and 1% down on the 2023 peak of £315,799.
Properties Sold
24, Merevale Road, Elmdon, Solihull B92 8LB
| Today | See what it's worth now |
| 27 Apr 2026 | £427,000 |
| 10 Aug 2018 | £308,000 |
Apartment 11, 115 Westley Heights, Warwick Road, Olton, Solihull B92 7JX

| Today | See what it's worth now |
| 23 Apr 2026 | £175,000 |
| 28 Mar 2002 | £166,950 |
No other historical records.
70e, Avon Court, St. Bernards Road, Olton, Solihull B92 7BP
| Today | See what it's worth now |
| 22 Apr 2026 | £204,000 |
| 5 Mar 2010 | £122,750 |
30, Masons Way, Olton, Solihull B92 7JE
| Today | See what it's worth now |
| 17 Apr 2026 | £264,500 |
No other historical records.
11, Wichnor Road, Solihull B92 7PU
| Today | See what it's worth now |
| 14 Apr 2026 | £275,000 |
| 5 Mar 2021 | £259,950 |
116, Marcot Road, Solihull B92 7PS

| Today | See what it's worth now |
| 7 Apr 2026 | £260,000 |
No other historical records.
44, Moordown Avenue, Solihull B92 8QW
| Today | See what it's worth now |
| 2 Apr 2026 | £300,000 |
| 2 Aug 2018 | £245,950 |
No other historical records.
27, Dene Court Road, Olton, Solihull B92 8DG
| Today | See what it's worth now |
| 1 Apr 2026 | £410,000 |
No other historical records.
164, Dorsington Road, Olton, Birmingham B27 7AF
| Today | See what it's worth now |
| 1 Apr 2026 | £251,000 |
| 6 Apr 2021 | £165,000 |
Apartment 21, 10 Olton Court, Warwick Road, Olton, Solihull B92 7HX
| Today | See what it's worth now |
| 27 Mar 2026 | £125,000 |
| 10 Nov 2016 | £120,000 |
No other historical records.
25, Rock Grove, Solihull B92 7LH
| Today | See what it's worth now |
| 26 Mar 2026 | £222,500 |
| 28 Nov 2017 | £189,950 |
No other historical records.
36, Raddington Drive, Olton, Solihull B92 7DU
| Today | See what it's worth now |
| 26 Mar 2026 | £524,000 |
| 30 Sep 2021 | £452,500 |
46e, Brackleys Way, Solihull B92 8QQ
| Today | See what it's worth now |
| 26 Mar 2026 | £265,000 |
| 24 Aug 2018 | £233,000 |
4, Greyfort Crescent, Olton, Solihull B92 8DW
| Today | See what it's worth now |
| 25 Mar 2026 | £385,000 |
| 8 Jul 1997 | £59,995 |
No other historical records.
1, Fentham Court, Olton, Solihull B92 8BD
| Today | See what it's worth now |
| 25 Mar 2026 | £175,000 |
| 30 Apr 2018 | £163,000 |
147, Wagon Lane, Solihull B92 7PD

| Today | See what it's worth now |
| 25 Mar 2026 | £265,000 |
| 19 Sep 2018 | £197,500 |
No other historical records.
11, Reservoir Road, Olton, Solihull B92 8BA
| Today | See what it's worth now |
| 23 Mar 2026 | £398,000 |
| 1 Oct 2007 | £310,500 |
No other historical records.
10, Kineton Croft, Olton, Solihull B92 7FG

| Today | See what it's worth now |
| 23 Mar 2026 | £340,000 |
| 20 Apr 2012 | £233,000 |
31, Butler Road, Solihull B92 7QL
| Today | See what it's worth now |
| 23 Mar 2026 | £375,000 |
| 20 Nov 2020 | £325,000 |
66, Harvard Road, Solihull B92 8EX
| Today | See what it's worth now |
| 23 Mar 2026 | £254,000 |
| 1 Dec 2017 | £260,000 |
83, Brookvale Road, Olton, Solihull B92 7JA
| Today | See what it's worth now |
| 20 Mar 2026 | £300,000 |
| 2 Aug 2002 | £134,000 |
135, Scott Road, Solihull B92 7LN
| Today | See what it's worth now |
| 20 Mar 2026 | £270,000 |
| 26 Jul 2024 | £150,000 |
No other historical records.
44, Shalford Road, Solihull B92 7NF

| Today | See what it's worth now |
| 20 Mar 2026 | £268,000 |
| 22 Feb 2019 | £220,000 |
No other historical records.

Source Acknowledgement: © Crown copyright. England and Wales house price data is publicly available information produced by the HM Land Registry.This material was last updated on 9 July 2026. It covers the period from 1 January 1995 to 30 April 2026 and contains property transactions which have been registered during that period. Contains HM Land Registry data © Crown copyright and database right 2026. This data is licensed under the Open Government Licence v3.0.
Disclaimer: Rightmove.co.uk provides this HM Land Registry data "as is". The burden for fitness of the data relies completely with the user and is provided for informational purposes only. No warranty, express or implied, is given relating to the accuracy of content of the HM Land Registry data and Rightmove does not accept any liability for error or omission. If you have found an error with the data or need further information please contact HM Land Registry.
Permitted Use: Viewers of this Information are granted permission to access this Crown copyright material and to download it onto electronic, magnetic, optical or similar storage media provided that such activities are for private research, study or in-house use only. Any other use of the material requires the formal written permission of Land Registry which can be requested from us, and is subject to an additional licence and associated charge.
Rightmove takes no liability for your use of, or reliance on, Rightmove's Instant Valuation due to the limitations of our tracking tool listed here. Use of this tool is taken entirely at your own risk. All rights reserved.