
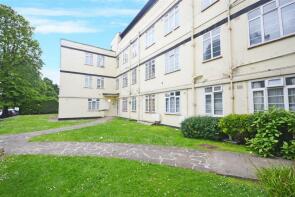
House Prices in Osterley Park
House prices in Osterley Park have an overall average of £490,538 over the last year.
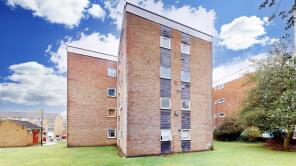
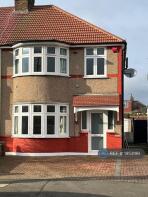
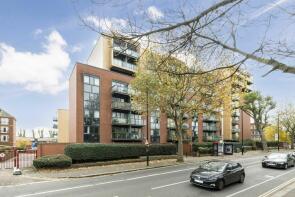
The majority of properties sold in Osterley Park during the last year were flats, selling for an average price of £336,675. Terraced properties sold for an average of £582,900, with semi-detached properties fetching £686,375.
Overall, the historical sold prices in Osterley Park over the last year were 13% down on the previous year and 8% down on the 2022 peak of £534,131.
Properties Sold
50, Star Road, Isleworth TW7 4HU
| Today | See what it's worth now |
| 2 Apr 2026 | £320,000 |
| 18 Jan 2008 | £292,000 |
No other historical records.
8, The Close, Isleworth TW7 4BL
| Today | See what it's worth now |
| 1 Apr 2026 | £572,500 |
No other historical records.
18, Thornbury Road, Isleworth TW7 4HG
| Today | See what it's worth now |
| 27 Mar 2026 | £535,000 |
| 15 Jan 2003 | £218,950 |
17, The Drive, Isleworth TW7 4AB
| Today | See what it's worth now |
| 27 Mar 2026 | £776,500 |
| 15 Nov 2013 | £549,950 |
No other historical records.
17, Deborah Close, Isleworth TW7 4NY
| Today | See what it's worth now |
| 27 Mar 2026 | £318,000 |
| 3 Jun 2021 | £330,000 |
131, Spencer Road, Isleworth TW7 4BW
| Today | See what it's worth now |
| 27 Mar 2026 | £500,000 |
| 26 Feb 2021 | £450,000 |
No other historical records.
668, Great West Road, Isleworth TW7 4PU
| Today | See what it's worth now |
| 27 Mar 2026 | £700,000 |
| 19 Oct 2015 | £540,000 |
10, Worton Gardens, Isleworth TW7 4BB
| Today | See what it's worth now |
| 17 Mar 2026 | £612,000 |
| 1 Dec 1997 | £80,000 |
No other historical records.
6, Deborah Close, Isleworth TW7 4NY

| Today | See what it's worth now |
| 13 Mar 2026 | £340,000 |
No other historical records.
Flat 26, West Court, Great West Road, Hounslow TW5 0TL
| Today | See what it's worth now |
| 9 Mar 2026 | £375,000 |
| 17 Dec 2020 | £335,000 |
No other historical records.
35, Aplin Way, Isleworth TW7 4RJ
| Today | See what it's worth now |
| 5 Mar 2026 | £325,000 |
| 31 Jul 2009 | £195,000 |
43, The Drive, Isleworth TW7 4AA
| Today | See what it's worth now |
| 4 Mar 2026 | £240,000 |
| 3 Oct 2003 | £289,950 |
No other historical records.
7, St Andrews Close, Isleworth TW7 4PG

| Today | See what it's worth now |
| 13 Feb 2026 | £300,000 |
| 20 Nov 2020 | £286,500 |
20, St Christophers Close, Isleworth TW7 4NP

| Today | See what it's worth now |
| 6 Feb 2026 | £522,500 |
| 25 Nov 2020 | £390,000 |
No other historical records.
Flat 9, West Court, Great West Road, Hounslow TW5 0TL

| Today | See what it's worth now |
| 6 Feb 2026 | £400,000 |
| 8 Feb 2016 | £360,000 |
21, St Christophers Close, Isleworth TW7 4NP
| Today | See what it's worth now |
| 27 Jan 2026 | £527,500 |
| 19 Nov 2010 | £250,000 |
No other historical records.
Flat 112, Westgate House, London Road, Isleworth TW7 4AS
| Today | See what it's worth now |
| 19 Dec 2025 | £332,000 |
| 1 Mar 2022 | £340,000 |
Flat 11, Thornbury Court, Church Road, Isleworth TW7 4PP
| Today | See what it's worth now |
| 19 Dec 2025 | £325,000 |
| 16 May 2012 | £240,000 |
No other historical records.
Flat 149, Westgate House, London Road, Isleworth TW7 4DJ
| Today | See what it's worth now |
| 19 Dec 2025 | £269,500 |
| 3 Oct 2023 | £243,000 |
No other historical records.
64, Draper Close, Isleworth TW7 4SX
| Today | See what it's worth now |
| 15 Dec 2025 | £321,500 |
| 17 Dec 1999 | £125,000 |
No other historical records.
17, The Brooklands, Eversley Crescent, Isleworth TW7 4LP
| Today | See what it's worth now |
| 8 Dec 2025 | £265,000 |
| 21 Sep 2001 | £130,000 |
No other historical records.
167, Spring Grove Road, Isleworth TW7 4BJ
| Today | See what it's worth now |
| 5 Dec 2025 | £883,000 |
| 14 Jul 2003 | £346,000 |
No other historical records.
Flat 23a, Odeon Parade, London Road, Isleworth TW7 4RL

| Today | See what it's worth now |
| 2 Dec 2025 | £275,000 |
| 16 Jun 2017 | £295,000 |
Source Acknowledgement: © Crown copyright. England and Wales house price data is publicly available information produced by the HM Land Registry.This material was last updated on 9 July 2026. It covers the period from 1 January 1995 to 30 April 2026 and contains property transactions which have been registered during that period. Contains HM Land Registry data © Crown copyright and database right 2026. This data is licensed under the Open Government Licence v3.0.
Disclaimer: Rightmove.co.uk provides this HM Land Registry data "as is". The burden for fitness of the data relies completely with the user and is provided for informational purposes only. No warranty, express or implied, is given relating to the accuracy of content of the HM Land Registry data and Rightmove does not accept any liability for error or omission. If you have found an error with the data or need further information please contact HM Land Registry.
Permitted Use: Viewers of this Information are granted permission to access this Crown copyright material and to download it onto electronic, magnetic, optical or similar storage media provided that such activities are for private research, study or in-house use only. Any other use of the material requires the formal written permission of Land Registry which can be requested from us, and is subject to an additional licence and associated charge.
Rightmove takes no liability for your use of, or reliance on, Rightmove's Instant Valuation due to the limitations of our tracking tool listed here. Use of this tool is taken entirely at your own risk. All rights reserved.