
House Prices in Overton Bridge
House prices in Overton Bridge have an overall average of £242,652 over the last year.
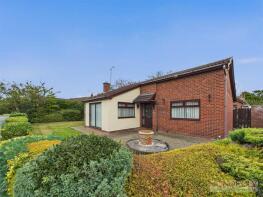
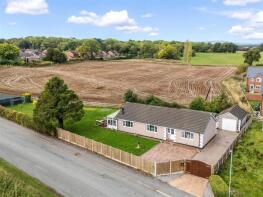
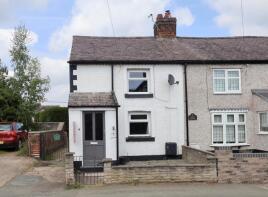
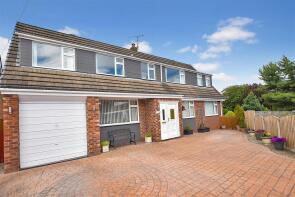
The majority of properties sold in Overton Bridge during the last year were detached properties, selling for an average price of £332,924. Semi-detached properties sold for an average of £206,090, with terraced properties fetching £154,125.
Overall, the historical sold prices in Overton Bridge over the last year were 6% down on the previous year and 6% down on the 2022 peak of £257,449.
Properties Sold
7, Green Farm Court, Penley, Wrexham LL13 0QJ
| Today | See what it's worth now |
| 31 Mar 2026 | £219,995 |
| 2 Feb 2023 | £189,995 |
No other historical records.
1, Riverdale, Wrexham LL13 8JF
| Today | See what it's worth now |
| 31 Mar 2026 | £137,000 |
| 17 Apr 2009 | £110,000 |
No other historical records.
3, Goodwood Grove, Wrexham LL13 0LX
| Today | See what it's worth now |
| 30 Mar 2026 | £172,000 |
| 24 Jul 2015 | £124,500 |
31, Pendas Park, Penley, Wrexham LL13 0NN
| Today | See what it's worth now |
| 20 Mar 2026 | £178,000 |
| 1 Dec 2017 | £115,000 |
1, Mill Court, Overton, Wrexham LL13 0EZ

| Today | See what it's worth now |
| 17 Mar 2026 | £370,000 |
| 2 May 2000 | £126,000 |
No other historical records.
8, Althrey Court, Overton Road, Bangor On Dee, Wrexham LL13 0DA
| Today | See what it's worth now |
| 13 Mar 2026 | £265,000 |
| 11 Jan 2006 | £185,000 |
No other historical records.
1, Church View, Overton Road, Penley, Wrexham LL13 0LU
| Today | See what it's worth now |
| 5 Mar 2026 | £315,000 |
| 21 May 2021 | £284,995 |
No other historical records.
10, St Marys Avenue, Overton, Wrexham LL13 0EP
| Today | See what it's worth now |
| 4 Mar 2026 | £200,000 |
| 24 Mar 2005 | £150,000 |
11, Ashburn Way, Wrexham LL13 0NP
| Today | See what it's worth now |
| 3 Mar 2026 | £190,000 |
| 27 Apr 2018 | £105,500 |
No other historical records.
1, Oak Drive, Overton, Wrexham LL13 0FF
| Today | See what it's worth now |
| 26 Feb 2026 | £630,000 |
| 24 Nov 2017 | £440,000 |
No other historical records.
1, The Orchards, Wrexham LL13 0NR
| Today | See what it's worth now |
| 20 Feb 2026 | £290,000 |
| 31 Jul 1996 | £84,950 |
No other historical records.
4, Church View, Station Road, Marchwiel, Wrexham LL13 0RT
| Today | See what it's worth now |
| 20 Feb 2026 | £195,000 |
No other historical records.
16, Winston Way, Penley, Wrexham LL13 0JT
| Today | See what it's worth now |
| 12 Feb 2026 | £350,000 |
| 29 Aug 2017 | £230,000 |
46, Pentre Gwyn, Wrexham LL13 8YE
| Today | See what it's worth now |
| 11 Feb 2026 | £143,000 |
No other historical records.
22, Greenways, Wrexham LL13 8JL
| Today | See what it's worth now |
| 9 Feb 2026 | £165,000 |
| 29 Jan 2018 | £118,000 |
26, Greenways, Wrexham LL13 8JL
| Today | See what it's worth now |
| 6 Feb 2026 | £167,500 |
| 29 Jul 2019 | £131,000 |
4, Brookfield Close, Penley, Wrexham LL13 0SJ
| Today | See what it's worth now |
| 6 Feb 2026 | £317,500 |
| 4 May 2018 | £220,000 |
No other historical records.
25, Whitland Way, Wrexham LL13 0JJ
| Today | See what it's worth now |
| 30 Jan 2026 | £185,000 |
| 2 Apr 2015 | £120,000 |
5, Moreton View, B5426 From Sontley Road To Bangor Road, Gyfelia, Wrexham LL13 0YN
| Today | See what it's worth now |
| 30 Jan 2026 | £171,000 |
| 15 Jul 2010 | £102,500 |
1, Abbey Gardens, Bangor On Dee, Wrexham LL13 0DZ
| Today | See what it's worth now |
| 26 Jan 2026 | £250,000 |
| 26 Mar 1999 | £78,950 |
No other historical records.
Wilmaye, Ellesmere Lane, Penley, Wrexham LL13 0LP
| Today | See what it's worth now |
| 23 Jan 2026 | £325,000 |
| 29 Jul 2021 | £233,000 |
No other historical records.
6, Kelso Close, Llwyn Onn Park, Wrexham LL13 0QN

| Today | See what it's worth now |
| 22 Jan 2026 | £280,000 |
| 25 Jul 2012 | £190,000 |
1, School Cottages, Wrexham Road, Marchwiel, Wrexham LL13 0PN
| Today | See what it's worth now |
| 16 Jan 2026 | £137,500 |
| 1 Aug 2007 | £115,000 |
Source Acknowledgement: © Crown copyright. England and Wales house price data is publicly available information produced by the HM Land Registry.This material was last updated on 9 July 2026. It covers the period from 1 January 1995 to 30 April 2026 and contains property transactions which have been registered during that period. Contains HM Land Registry data © Crown copyright and database right 2026. This data is licensed under the Open Government Licence v3.0.
Disclaimer: Rightmove.co.uk provides this HM Land Registry data "as is". The burden for fitness of the data relies completely with the user and is provided for informational purposes only. No warranty, express or implied, is given relating to the accuracy of content of the HM Land Registry data and Rightmove does not accept any liability for error or omission. If you have found an error with the data or need further information please contact HM Land Registry.
Permitted Use: Viewers of this Information are granted permission to access this Crown copyright material and to download it onto electronic, magnetic, optical or similar storage media provided that such activities are for private research, study or in-house use only. Any other use of the material requires the formal written permission of Land Registry which can be requested from us, and is subject to an additional licence and associated charge.
Rightmove takes no liability for your use of, or reliance on, Rightmove's Instant Valuation due to the limitations of our tracking tool listed here. Use of this tool is taken entirely at your own risk. All rights reserved.