
House Prices in Oxton
House prices in Oxton have an overall average of £250,940 over the last year.
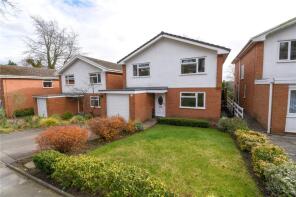
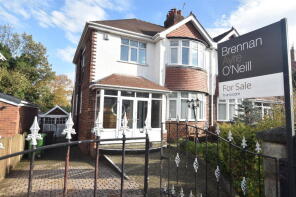
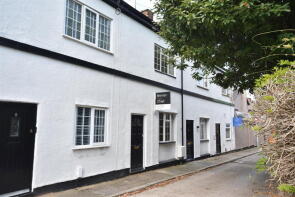
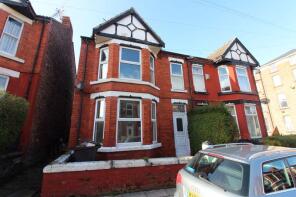
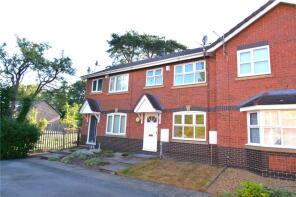
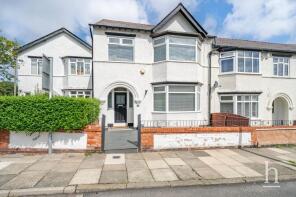
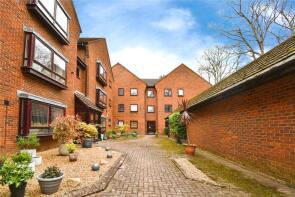
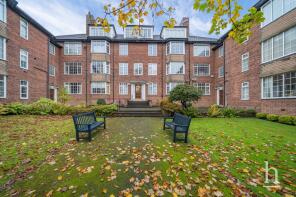
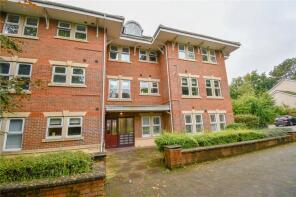
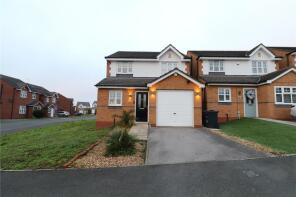
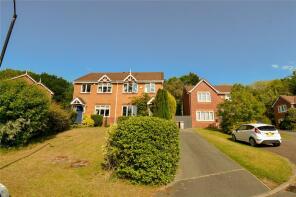
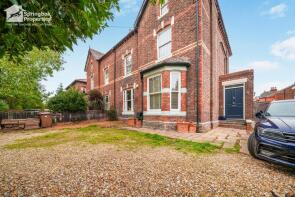
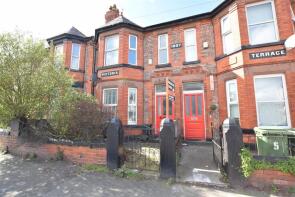
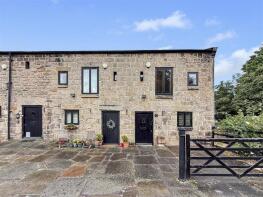
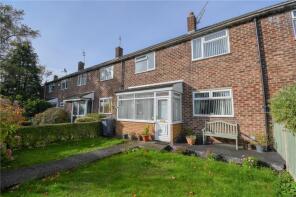
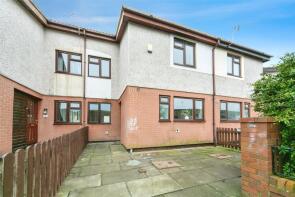
The majority of properties sold in Oxton during the last year were semi-detached properties, selling for an average price of £253,755. Flats sold for an average of £152,089, with terraced properties fetching £206,367.
Overall, the historical sold prices in Oxton over the last year were 3% up on the previous year and 2% up on the 2021 peak of £246,933.
Properties Sold
61, Arno Road, Oxton CH43 5SL
| Today | See what it's worth now |
| 17 Apr 2026 | £368,000 |
No other historical records.
36, Egerton Road, Prenton CH43 1UJ
| Today | See what it's worth now |
| 17 Apr 2026 | £282,000 |
| 6 Nov 2009 | £195,000 |
7, Enfield Terrace, Prenton CH43 4UB

| Today | See what it's worth now |
| 15 Apr 2026 | £47,500 |
| 23 Jul 2021 | £180,000 |
6, Prices Lane, Prenton CH43 5TD
| Today | See what it's worth now |
| 14 Apr 2026 | £190,000 |
| 31 Jul 2003 | £110,000 |
No other historical records.
4, Merton Place, Prenton CH43 4XD
| Today | See what it's worth now |
| 14 Apr 2026 | £200,000 |
| 16 Oct 2020 | £127,000 |
10, Chelford Close, Prenton CH43 7NJ
| Today | See what it's worth now |
| 10 Apr 2026 | £140,000 |
| 15 Jun 2018 | £115,000 |
44, Speedwell Road, Birkenhead CH41 0DP
| Today | See what it's worth now |
| 31 Mar 2026 | £240,000 |
| 8 Apr 2016 | £137,000 |
19, Foxdale Close, Prenton CH43 1XW

| Today | See what it's worth now |
| 31 Mar 2026 | £225,000 |
| 13 Mar 2008 | £154,000 |
No other historical records.
12, 43 The Cresson, Bidston Road, Prenton CH43 6UJ
| Today | See what it's worth now |
| 31 Mar 2026 | £150,000 |
| 5 Jan 1998 | £43,500 |
No other historical records.
12, Oxton Court, Rose Mount, Prenton CH43 5SU
| Today | See what it's worth now |
| 31 Mar 2026 | £220,000 |
| 30 Apr 2021 | £158,000 |
Flat 3, 8 Bishops Court, Storeton Road, Prenton CH43 5XG
| Today | See what it's worth now |
| 27 Mar 2026 | £147,000 |
| 3 Jun 2003 | £124,950 |
No other historical records.
6, Proudman Drive, Prenton CH43 7NA
| Today | See what it's worth now |
| 27 Mar 2026 | £221,000 |
| 30 Mar 2012 | £143,950 |
No other historical records.
17, Grappenhall Way, Prenton CH43 7NH
| Today | See what it's worth now |
| 16 Mar 2026 | £210,000 |
| 18 Oct 2019 | £160,000 |
40, Grosvenor Road, Prenton CH43 1TL
| Today | See what it's worth now |
| 16 Mar 2026 | £426,000 |
| 25 May 2000 | £75,000 |
No other historical records.
3, Heathfield Road, Prenton CH43 5RT
| Today | See what it's worth now |
| 13 Mar 2026 | £210,000 |
| 20 Oct 2022 | £170,000 |
2, Bidston Hall Farm Mews, Bidston Village Road, Prenton CH43 7RZ
| Today | See what it's worth now |
| 13 Mar 2026 | £212,000 |
| 10 Dec 2021 | £160,000 |
No other historical records.
89, Fairview Road, Oxton CH43 5UL
| Today | See what it's worth now |
| 11 Mar 2026 | £190,000 |
No other historical records.
4, Keele Close, Prenton CH43 7XJ
| Today | See what it's worth now |
| 6 Mar 2026 | £165,000 |
| 6 Jul 2006 | £72,000 |
37, Helton Close, Prenton CH43 9HP
| Today | See what it's worth now |
| 6 Mar 2026 | £167,500 |
| 22 Sep 2022 | £175,000 |
16, Davenham Avenue, Prenton CH43 2LW
| Today | See what it's worth now |
| 6 Mar 2026 | £250,000 |
| 27 Jan 2017 | £186,500 |
5, Utkinton Close, Prenton CH43 2GP
| Today | See what it's worth now |
| 6 Mar 2026 | £380,000 |
| 4 Aug 2021 | £310,000 |
No other historical records.
2, Anson Mews, Sumner Road, Prenton CH43 7SX

| Today | See what it's worth now |
| 4 Mar 2026 | £150,000 |
| 3 Oct 2023 | £140,000 |
12, Reedville, Prenton CH43 4UH
| Today | See what it's worth now |
| 4 Mar 2026 | £390,000 |
| 29 May 2001 | £68,500 |
No other historical records.
Source Acknowledgement: © Crown copyright. England and Wales house price data is publicly available information produced by the HM Land Registry.This material was last updated on 9 July 2026. It covers the period from 1 January 1995 to 30 April 2026 and contains property transactions which have been registered during that period. Contains HM Land Registry data © Crown copyright and database right 2026. This data is licensed under the Open Government Licence v3.0.
Disclaimer: Rightmove.co.uk provides this HM Land Registry data "as is". The burden for fitness of the data relies completely with the user and is provided for informational purposes only. No warranty, express or implied, is given relating to the accuracy of content of the HM Land Registry data and Rightmove does not accept any liability for error or omission. If you have found an error with the data or need further information please contact HM Land Registry.
Permitted Use: Viewers of this Information are granted permission to access this Crown copyright material and to download it onto electronic, magnetic, optical or similar storage media provided that such activities are for private research, study or in-house use only. Any other use of the material requires the formal written permission of Land Registry which can be requested from us, and is subject to an additional licence and associated charge.
Rightmove takes no liability for your use of, or reliance on, Rightmove's Instant Valuation due to the limitations of our tracking tool listed here. Use of this tool is taken entirely at your own risk. All rights reserved.