
House Prices in Pickford
House prices in Pickford have an overall average of £239,611 over the last year.
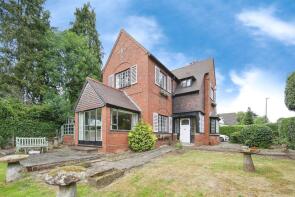
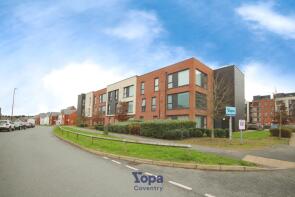
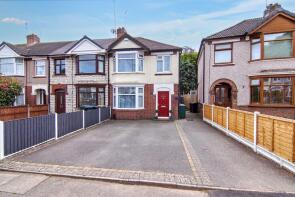
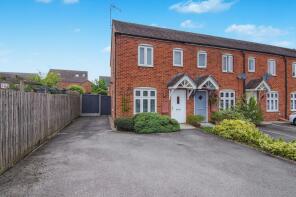
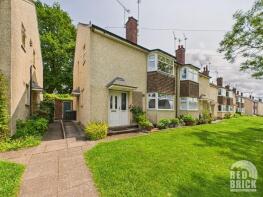
The majority of properties sold in Pickford during the last year were terraced properties, selling for an average price of £225,300. Semi-detached properties sold for an average of £254,597, with detached properties fetching £340,906.
Overall, the historical sold prices in Pickford over the last year were 4% up on the previous year and 3% up on the 2023 peak of £231,733.
Properties Sold
35, Hendre Close, Coventry CV5 7AG
| Today | See what it's worth now |
| 18 Dec 2025 | £210,000 |
| 10 Nov 2017 | £162,000 |
1, Hedgefield Way, Coventry CV4 9HF
| Today | See what it's worth now |
| 11 Dec 2025 | £225,000 |
| 24 Jun 2016 | £180,000 |
259, Jardine Crescent, Coventry CV4 9QR
| Today | See what it's worth now |
| 8 Dec 2025 | £150,000 |
| 19 Apr 2006 | £104,000 |
69, Manhattan Way, Coventry CV4 9GE


| Today | See what it's worth now |
| 3 Dec 2025 | £265,000 |
| 15 Dec 2015 | £183,000 |
142, Standard Avenue, Coventry CV4 9BS
| Today | See what it's worth now |
| 3 Dec 2025 | £210,000 |
| 17 Mar 2017 | £152,000 |
No other historical records.
76, Station Avenue, Coventry CV4 9HS
| Today | See what it's worth now |
| 2 Dec 2025 | £350,000 |
No other historical records.
1, Pelham Bend, Coventry CV4 9GT
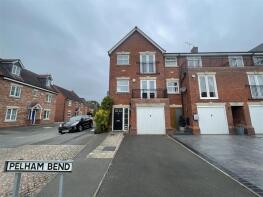
| Today | See what it's worth now |
| 1 Dec 2025 | £282,000 |
| 10 Jul 2014 | £199,995 |
24, Gaza Close, Coventry CV4 9EF
| Today | See what it's worth now |
| 21 Nov 2025 | £240,000 |
| 9 Feb 2001 | £113,700 |
No other historical records.
15, Lawley Close, Coventry CV4 9EA
| Today | See what it's worth now |
| 19 Nov 2025 | £240,000 |
| 27 Sep 2019 | £170,000 |
No other historical records.
25, Cavendish Road, Coventry CV4 9LW

| Today | See what it's worth now |
| 18 Nov 2025 | £195,000 |
| 6 Dec 2021 | £154,000 |
45, Limbrick Avenue, Coventry CV4 9EX

| Today | See what it's worth now |
| 17 Nov 2025 | £213,000 |
| 16 Oct 2009 | £95,000 |
No other historical records.
86, Monticello Way, Coventry CV4 9WA
| Today | See what it's worth now |
| 14 Nov 2025 | £145,000 |
| 14 Oct 2014 | £115,995 |
No other historical records.
147, Standard Avenue, Coventry CV4 9BT
| Today | See what it's worth now |
| 7 Nov 2025 | £215,000 |
| 19 Dec 2018 | £184,000 |
3, Niagara Close, Coventry CV4 9WF
| Today | See what it's worth now |
| 7 Nov 2025 | £230,000 |
| 9 Mar 2021 | £200,000 |
42, Berners Close, Coventry CV4 9LY
| Today | See what it's worth now |
| 30 Oct 2025 | £68,000 |
| 10 Jun 2011 | £41,500 |
16, Wilman Close, Coventry CV4 9WQ

| Today | See what it's worth now |
| 27 Oct 2025 | £271,500 |
| 15 May 2015 | £174,650 |
No other historical records.
9, Holly Grove, Coventry CV4 9EQ
| Today | See what it's worth now |
| 23 Oct 2025 | £202,500 |
| 8 Apr 2021 | £174,000 |
22, Nailcote Avenue, Coventry CV4 9GL
| Today | See what it's worth now |
| 17 Oct 2025 | £320,000 |
| 27 Jan 2012 | £240,000 |
159, Eastcotes, Coventry CV4 9AT
| Today | See what it's worth now |
| 17 Oct 2025 | £195,000 |
| 27 Aug 2021 | £175,000 |
17, Tilehurst Drive, Coventry CV4 9TH

| Today | See what it's worth now |
| 14 Oct 2025 | £415,000 |
| 22 Jul 2016 | £269,000 |
54, Westcotes, Coventry CV4 9BD
| Today | See what it's worth now |
| 14 Oct 2025 | £270,000 |
| 21 Aug 2015 | £165,000 |
5, Pelham Bend, Coventry CV4 9GT
| Today | See what it's worth now |
| 3 Oct 2025 | £277,500 |
| 26 Apr 2007 | £190,000 |
No other historical records.
9, Porter Close, Coventry CV4 9RR
| Today | See what it's worth now |
| 3 Oct 2025 | £185,000 |
| 27 Jan 2006 | £105,000 |
No other historical records.
145, Middlecotes, Coventry CV4 9AY
| Today | See what it's worth now |
| 2 Oct 2025 | £198,000 |
| 17 Dec 1999 | £51,500 |
Ravenswood, Nailcote Avenue, Coventry CV4 9GJ
| Today | See what it's worth now |
| 30 Sep 2025 | £384,000 |
| 16 Jun 2023 | £165,000 |
No other historical records.
Source Acknowledgement: © Crown copyright. England and Wales house price data is publicly available information produced by the HM Land Registry.This material was last updated on 4 February 2026. It covers the period from 1 January 1995 to 24 December 2025 and contains property transactions which have been registered during that period. Contains HM Land Registry data © Crown copyright and database right 2026. This data is licensed under the Open Government Licence v3.0.
Disclaimer: Rightmove.co.uk provides this HM Land Registry data "as is". The burden for fitness of the data relies completely with the user and is provided for informational purposes only. No warranty, express or implied, is given relating to the accuracy of content of the HM Land Registry data and Rightmove does not accept any liability for error or omission. If you have found an error with the data or need further information please contact HM Land Registry.
Permitted Use: Viewers of this Information are granted permission to access this Crown copyright material and to download it onto electronic, magnetic, optical or similar storage media provided that such activities are for private research, study or in-house use only. Any other use of the material requires the formal written permission of Land Registry which can be requested from us, and is subject to an additional licence and associated charge.
Map data ©OpenStreetMap contributors.
Rightmove takes no liability for your use of, or reliance on, Rightmove's Instant Valuation due to the limitations of our tracking tool listed here. Use of this tool is taken entirely at your own risk. All rights reserved.