
House Prices in Fishbourne Road East, Chichester, West Sussex, PO19
House prices in Fishbourne Road East have an overall average of £540,000 over the last year.
Overall, the historical sold prices in Fishbourne Road East over the last year were 144% up on the previous year and 10% down on the 2018 peak of £601,000.
Properties Sold
6, Fishbourne Road East, Chichester PO19 3HU
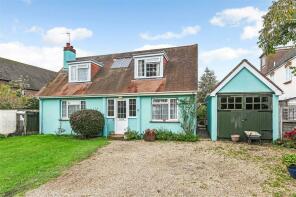
| Today | See what it's worth now |
| 15 Aug 2024 | £540,000 |
| 3 Feb 1998 | £124,100 |
Flat 1, 31 Warwick House, Fishbourne Road East, Chichester PO19 3HS

| Today | See what it's worth now |
| 7 Jun 2024 | £146,487 |
| 13 Oct 2015 | £165,000 |
Flat 10, Willow Court, Fishbourne Road East, Chichester PO19 3HL
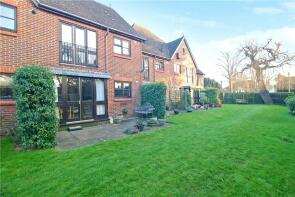
| Today | See what it's worth now |
| 10 May 2024 | £189,000 |
| 27 Apr 2007 | £162,000 |
No other historical records.
Flat 14, Willow Court, Fishbourne Road East, Chichester PO19 3HL
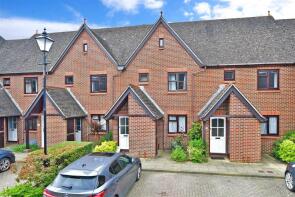
| Today | See what it's worth now |
| 5 Oct 2023 | £180,000 |
| 17 May 1996 | £47,650 |
No other historical records.
Flat 37, Willow Court, Fishbourne Road East, Chichester PO19 3HL
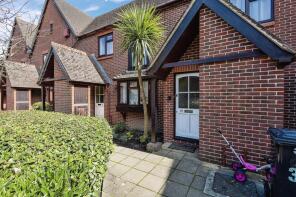
| Today | See what it's worth now |
| 4 Oct 2023 | £216,500 |
| 9 May 2006 | £164,995 |
Flat 40, Willow Court, Fishbourne Road East, Chichester PO19 3HL
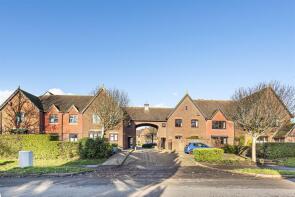
| Today | See what it's worth now |
| 15 Sep 2023 | £210,000 |
| 27 Jun 2006 | £178,500 |
30, Fishbourne Road East, Chichester PO19 3JA

| Today | See what it's worth now |
| 25 Aug 2023 | £385,000 |
No other historical records.
Flat 39, Willow Court, Fishbourne Road East, Chichester PO19 3HL
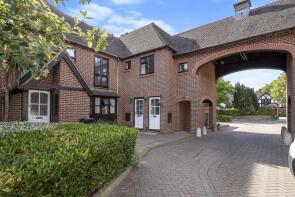
| Today | See what it's worth now |
| 5 Jun 2023 | £245,000 |
No other historical records.
Flat 42, Willow Court, Fishbourne Road East, Chichester PO19 3HL
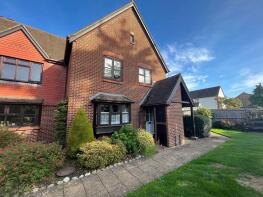
| Today | See what it's worth now |
| 4 Mar 2022 | £233,500 |
| 27 Jul 2004 | £183,000 |
Flat 5, Willow Court, Fishbourne Road East, Chichester PO19 3HL
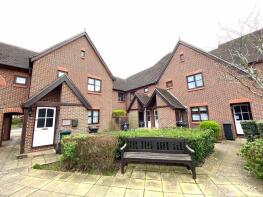
| Today | See what it's worth now |
| 26 Jan 2022 | £200,000 |
| 19 Aug 2015 | £167,000 |
Flat 20, Willow Court, Fishbourne Road East, Chichester PO19 3HL
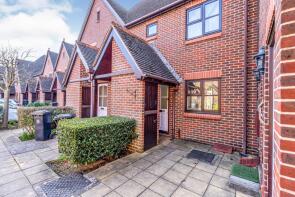
| Today | See what it's worth now |
| 6 Aug 2021 | £187,187 |
No other historical records.
Flat 9, Willow Court, Fishbourne Road East, Chichester PO19 3HL
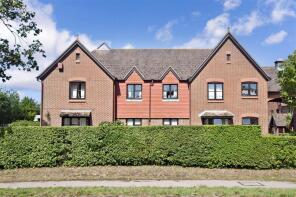
| Today | See what it's worth now |
| 21 May 2021 | £190,000 |
| 5 Feb 2010 | £137,000 |
9, Paveley House, Fishbourne Road East, Chichester PO19 3BY
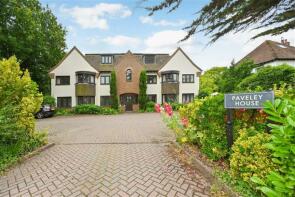
| Today | See what it's worth now |
| 23 Mar 2021 | £235,000 |
| 23 Jan 2019 | £235,000 |
Flat 31, Willow Court, Fishbourne Road East, Chichester PO19 3HL

| Today | See what it's worth now |
| 17 Mar 2021 | £216,000 |
| 30 Jul 2012 | £171,000 |
11, Paveley House, Fishbourne Road East, Chichester PO19 3BY
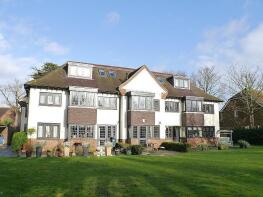
| Today | See what it's worth now |
| 15 Mar 2021 | £256,000 |
| 16 Dec 2016 | £247,500 |
34, Fishbourne Road East, Chichester PO19 3RD

| Today | See what it's worth now |
| 18 Dec 2020 | £215,000 |
No other historical records.
2, Paveley House, Fishbourne Road East, Chichester PO19 3BY
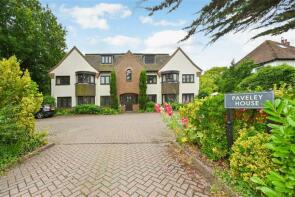
| Today | See what it's worth now |
| 20 Oct 2020 | £235,000 |
| 29 May 2015 | £206,000 |
Flat 25, Willow Court, Fishbourne Road East, Chichester PO19 3HL
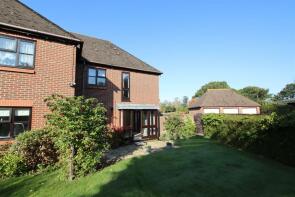
| Today | See what it's worth now |
| 1 Sep 2020 | £217,650 |
| 1 Sep 2000 | £102,500 |
Flat 11, Willow Court, Fishbourne Road East, Chichester PO19 3HL
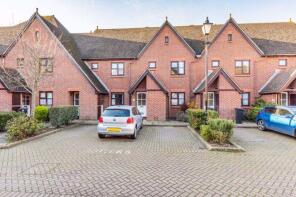
| Today | See what it's worth now |
| 19 Aug 2020 | £201,000 |
| 22 Mar 2006 | £137,000 |
32, Fishbourne Road East, Chichester PO19 3RD

| Today | See what it's worth now |
| 24 Jun 2020 | £215,000 |
No other historical records.
41, Fishbourne Road East, Chichester PO19 3HZ

| Today | See what it's worth now |
| 1 Oct 2019 | £795,000 |
| 22 Sep 2015 | £660,000 |
19, Fishbourne Road East, Chichester PO19 3HS

| Today | See what it's worth now |
| 26 Sep 2018 | £790,000 |
No other historical records.
18, Fishbourne Road East, Chichester PO19 3HX
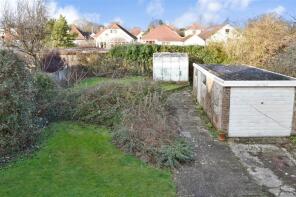
| Today | See what it's worth now |
| 9 Feb 2018 | £412,000 |
No other historical records.
26, Fishbourne Road East, Chichester PO19 3JA

| Today | See what it's worth now |
| 22 Nov 2017 | £470,000 |
| 8 Sep 1998 | £152,000 |
No other historical records.
8, Paveley House, Fishbourne Road East, Chichester PO19 3BY
| Today | See what it's worth now |
| 15 Nov 2017 | £225,000 |
| 18 Jan 2011 | £178,000 |
Find out how much your property is worth
The following agents can provide you with a free, no-obligation valuation. Simply select the ones you'd like to hear from.
Sponsored
All featured agents have paid a fee to promote their valuation expertise.

Stride and Son
Chichester

King & Chasemore
Chichester

Leaders Sales
Bognor Regis

PMS Lettings & Sales
Chichester

Bell and Blake
Chichester

White & Brooks
Chichester
Get ready with a Mortgage in Principle
- Personalised result in just 20 minutes
- Find out how much you can borrow
- Get viewings faster with agents
- No impact on your credit score
What's your property worth?
House prices near Fishbourne Road East
Source Acknowledgement: © Crown copyright. England and Wales house price data is publicly available information produced by the HM Land Registry.This material was last updated on 16 July 2025. It covers the period from 1 January 1995 to 30 May 2025 and contains property transactions which have been registered during that period. Contains HM Land Registry data © Crown copyright and database right 2025. This data is licensed under the Open Government Licence v3.0.
Disclaimer: Rightmove.co.uk provides this HM Land Registry data "as is". The burden for fitness of the data relies completely with the user and is provided for informational purposes only. No warranty, express or implied, is given relating to the accuracy of content of the HM Land Registry data and Rightmove does not accept any liability for error or omission. If you have found an error with the data or need further information please contact HM Land Registry.
Permitted Use: Viewers of this Information are granted permission to access this Crown copyright material and to download it onto electronic, magnetic, optical or similar storage media provided that such activities are for private research, study or in-house use only. Any other use of the material requires the formal written permission of Land Registry which can be requested from us, and is subject to an additional licence and associated charge.
Data on planning applications, home extensions and build costs is provided by Resi.co.uk. Planning data is calculated using the last 2 years of residential applications within the selected planning authority. Home extension data, such as build costs and project timelines, are calculated using approximately 9,000 architectural projects Resi has completed, and 23,500 builders quotes submitted via Resi's platform. Build costs are adjusted according to inflation rates to more accurately represent today's prices.
Map data ©OpenStreetMap contributors.
Rightmove takes no liability for your use of, or reliance on, Rightmove's Instant Valuation due to the limitations of our tracking tool listed here. Use of this tool is taken entirely at your own risk. All rights reserved.

