
House Prices in Rainbow Hill
House prices in Rainbow Hill have an overall average of £268,428 over the last year.
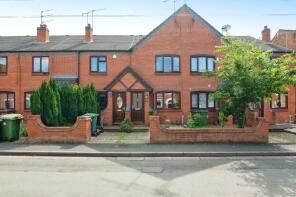
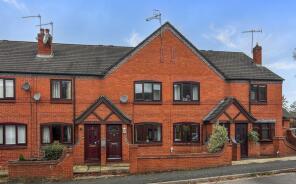
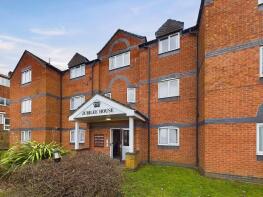
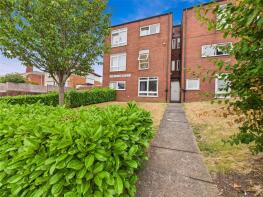
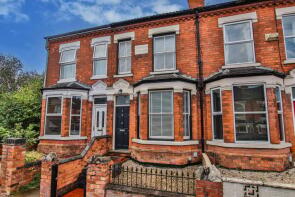
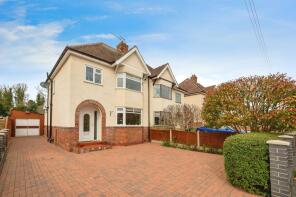
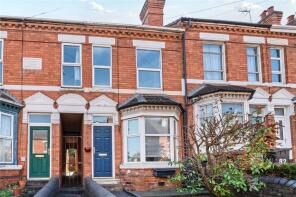
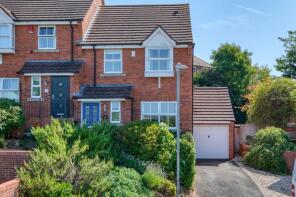
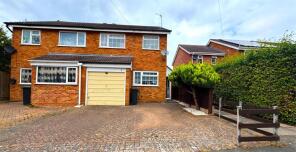
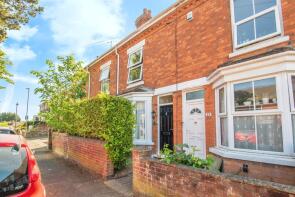
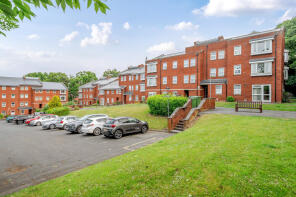
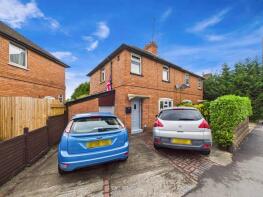
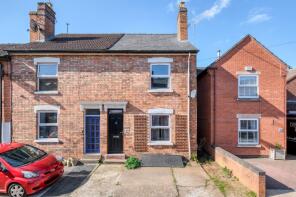
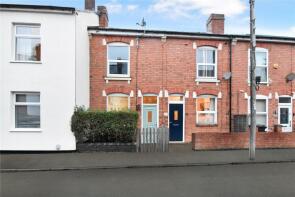
The majority of properties sold in Rainbow Hill during the last year were terraced properties, selling for an average price of £242,431. Semi-detached properties sold for an average of £260,600, with flats fetching £153,181.
Overall, the historical sold prices in Rainbow Hill over the last year were 4% down on the previous year and 6% down on the 2023 peak of £284,890.
Properties Sold
48, New Bank Street, Worcester WR3 8AN
| Today | See what it's worth now |
| 13 Apr 2026 | £230,000 |
| 2 Sep 2024 | £220,000 |
6, Raglan Street, Worcester WR3 8AY
| Today | See what it's worth now |
| 8 Apr 2026 | £213,000 |
| 16 Jul 2010 | £137,500 |
10, 71 Jubilee House, Mayfield Road, Worcester WR3 8NR
| Today | See what it's worth now |
| 2 Apr 2026 | £160,000 |
| 31 Jan 2018 | £120,000 |
31, Church Road, Worcester WR3 8NX

| Today | See what it's worth now |
| 1 Apr 2026 | £200,000 |
| 29 Sep 2014 | £139,000 |
12, Belmont Lodge, Mayfield Road, Worcester WR3 8NN
| Today | See what it's worth now |
| 1 Apr 2026 | £145,000 |
| 30 Mar 2007 | £104,000 |
3, Rogers Hill, Worcester WR3 8JQ
| Today | See what it's worth now |
| 31 Mar 2026 | £240,000 |
| 30 May 2017 | £202,000 |
93 The Retreat, Droitwich Road, Worcester WR3 8RJ
| Today | See what it's worth now |
| 10 Mar 2026 | £390,000 |
| 21 Dec 2004 | £150,000 |
No other historical records.
36, Kingston Avenue, Worcester WR3 8PW
| Today | See what it's worth now |
| 4 Mar 2026 | £373,000 |
| 3 Nov 2017 | £235,000 |
15, Agatha Gardens, Worcester WR3 8PB
| Today | See what it's worth now |
| 27 Feb 2026 | £580,000 |
| 16 Jul 1999 | £174,950 |
No other historical records.
20, Elgar Court, Rainbow Hill, Worcester WR3 8NF
| Today | See what it's worth now |
| 26 Feb 2026 | £110,000 |
| 19 Oct 2018 | £97,000 |
6, Kerry Hill, Worcester WR3 8QQ
| Today | See what it's worth now |
| 20 Feb 2026 | £442,500 |
| 16 Feb 2024 | £406,500 |
No other historical records.
23, Woodland Close, Worcester WR3 8HU
| Today | See what it's worth now |
| 13 Feb 2026 | £125,000 |
| 20 Aug 2021 | £110,000 |
40, Green Lane, Worcester WR3 8NY
| Today | See what it's worth now |
| 12 Feb 2026 | £210,000 |
| 7 Oct 1999 | £55,000 |
No other historical records.
1, Crescent Villas, Rainbow Hill, Worcester WR3 8NA

| Today | See what it's worth now |
| 2 Feb 2026 | £250,000 |
| 6 Jan 2016 | £155,000 |
94, Astwood Road, Worcester WR3 8EZ
| Today | See what it's worth now |
| 23 Jan 2026 | £177,000 |
| 31 May 2007 | £152,000 |
14, Abberley View, Worcester WR3 8LU
| Today | See what it's worth now |
| 23 Jan 2026 | £325,000 |
| 25 Sep 2020 | £250,000 |
16, Colehurst Park, Lansdowne Walk, Worcester WR3 8JF

| Today | See what it's worth now |
| 16 Jan 2026 | £193,000 |
| 8 Jul 2014 | £135,000 |
No other historical records.
3, Dryden Close, Worcester WR3 8ED
| Today | See what it's worth now |
| 16 Jan 2026 | £234,000 |
| 18 Aug 2000 | £77,000 |
No other historical records.
23, Church Road, Worcester WR3 8NX
| Today | See what it's worth now |
| 8 Jan 2026 | £207,000 |
| 23 Nov 2018 | £167,500 |
5, Lansdowne Rise, Lansdowne Road, Worcester WR3 8LN
| Today | See what it's worth now |
| 8 Jan 2026 | £151,000 |
| 18 Jun 2021 | £215,000 |
109, Astwood Road, Worcester WR3 8HA
| Today | See what it's worth now |
| 19 Dec 2025 | £205,000 |
No other historical records.
43, Mayfield Road, Worcester WR3 8NS
| Today | See what it's worth now |
| 19 Dec 2025 | £267,000 |
| 28 Sep 2015 | £175,000 |
No other historical records.
5, Gillam Street, Worcester WR3 8JT
| Today | See what it's worth now |
| 18 Dec 2025 | £212,500 |
| 4 Jun 2021 | £175,000 |
Source Acknowledgement: © Crown copyright. England and Wales house price data is publicly available information produced by the HM Land Registry.This material was last updated on 9 July 2026. It covers the period from 1 January 1995 to 30 April 2026 and contains property transactions which have been registered during that period. Contains HM Land Registry data © Crown copyright and database right 2026. This data is licensed under the Open Government Licence v3.0.
Disclaimer: Rightmove.co.uk provides this HM Land Registry data "as is". The burden for fitness of the data relies completely with the user and is provided for informational purposes only. No warranty, express or implied, is given relating to the accuracy of content of the HM Land Registry data and Rightmove does not accept any liability for error or omission. If you have found an error with the data or need further information please contact HM Land Registry.
Permitted Use: Viewers of this Information are granted permission to access this Crown copyright material and to download it onto electronic, magnetic, optical or similar storage media provided that such activities are for private research, study or in-house use only. Any other use of the material requires the formal written permission of Land Registry which can be requested from us, and is subject to an additional licence and associated charge.
Rightmove takes no liability for your use of, or reliance on, Rightmove's Instant Valuation due to the limitations of our tracking tool listed here. Use of this tool is taken entirely at your own risk. All rights reserved.