
House Prices in Redgrave
House prices in Redgrave have an overall average of £393,750 over the last year.
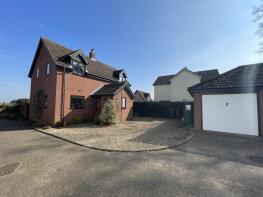
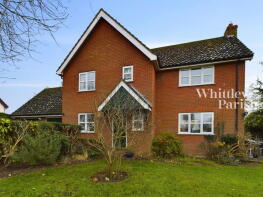
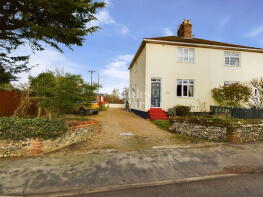
The majority of properties sold in Redgrave during the last year were detached properties, selling for an average price of £420,833. Semi-detached properties sold for an average of £312,500.
Overall, the historical sold prices in Redgrave over the last year were 26% down on the previous year and 36% down on the 2022 peak of £616,429.
Properties Sold
2, Birds Cottages, Half Moon Lane, Diss IP22 1RX
| Today | See what it's worth now |
| 7 Nov 2025 | £387,500 |
| 6 Nov 2017 | £290,000 |
Ridley House, Half Moon Lane, Redgrave IP22 1RX
| Today | See what it's worth now |
| 3 Oct 2025 | £425,000 |
No other historical records.
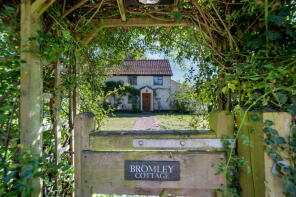
Bromley Cottage, The Green, Diss IP22 1RR
| Today | See what it's worth now |
| 29 Aug 2025 | £450,000 |
| 21 Sep 2007 | £262,500 |
Prospect Cottage, The Street, Redgrave IP22 1RY
| Today | See what it's worth now |
| 15 Aug 2025 | £312,500 |
No other historical records.
Magnolias, Churchway, Diss IP22 1RL
| Today | See what it's worth now |
| 27 Feb 2025 | £490,000 |
| 22 Aug 2019 | £420,000 |
3, Birds Cottages, Half Moon Lane, Diss IP22 1RX
| Today | See what it's worth now |
| 9 Jan 2025 | £365,000 |
| 16 Sep 2015 | £245,000 |
No other historical records.
Crackthorn Cottage, The Street, Diss IP22 1RY
| Today | See what it's worth now |
| 27 Sep 2024 | £402,000 |
| 19 Jul 2013 | £225,000 |
Park Lodge, Hall Lane, Redgrave IP22 1RT

| Today | See what it's worth now |
| 19 Sep 2024 | £430,000 |
No other historical records.
2, Thornhill Green, Redgrave IP22 1FN
| Today | See what it's worth now |
| 15 Aug 2024 | £625,000 |
No other historical records.
5, Thornhill Green, Redgrave IP22 1FN
| Today | See what it's worth now |
| 15 Aug 2024 | £862,450 |
No other historical records.
4, Thornhill Green, Redgrave IP22 1FN
| Today | See what it's worth now |
| 23 May 2024 | £610,000 |
No other historical records.
1, Thornhill Green, Redgrave IP22 1FN
| Today | See what it's worth now |
| 9 May 2024 | £640,000 |
No other historical records.
Keys Cottage, The Street, Diss IP22 1RW

| Today | See what it's worth now |
| 19 Apr 2024 | £600,000 |
| 21 Nov 2008 | £200,000 |
3, Thornhill Green, Redgrave IP22 1FN

| Today | See what it's worth now |
| 22 Jan 2024 | £598,000 |
No other historical records.
The Kyles, The Street, Diss IP22 1RY
| Today | See what it's worth now |
| 20 Dec 2023 | £505,000 |
| 20 Oct 2015 | £415,000 |
3, Knoll Close, Diss IP22 1QX
| Today | See what it's worth now |
| 24 Oct 2023 | £475,000 |
| 11 Nov 1996 | £40,000 |
No other historical records.
6, Thornhill Green, Redgrave IP22 1FN
| Today | See what it's worth now |
| 29 Sep 2023 | £848,000 |
No other historical records.
4, Chestnut Tree Close, Diss IP22 1RQ

| Today | See what it's worth now |
| 17 Aug 2023 | £480,000 |
| 30 Sep 2013 | £270,000 |
Tanglewood, The Street, Diss IP22 1RP

| Today | See what it's worth now |
| 11 May 2023 | £352,500 |
| 27 Nov 2009 | £186,000 |
Ivy House Farm, The Street, Diss IP22 1RY
| Today | See what it's worth now |
| 28 Apr 2023 | £750,000 |
No other historical records.
The Old Cart Lodge, The Street, Diss IP22 1RY
| Today | See what it's worth now |
| 23 Feb 2023 | £515,000 |
| 28 Jul 2017 | £425,000 |
Glebe Cottage, The Street, Diss IP22 1RW

| Today | See what it's worth now |
| 7 Dec 2022 | £750,000 |
| 25 Jan 2021 | £645,000 |
Rose Cottage, Half Moon Lane, Diss IP22 1RX
| Today | See what it's worth now |
| 29 Nov 2022 | £495,000 |
| 19 Oct 2016 | £312,500 |
Source Acknowledgement: © Crown copyright. England and Wales house price data is publicly available information produced by the HM Land Registry.This material was last updated on 9 July 2026. It covers the period from 1 January 1995 to 30 April 2026 and contains property transactions which have been registered during that period. Contains HM Land Registry data © Crown copyright and database right 2026. This data is licensed under the Open Government Licence v3.0.
Disclaimer: Rightmove.co.uk provides this HM Land Registry data "as is". The burden for fitness of the data relies completely with the user and is provided for informational purposes only. No warranty, express or implied, is given relating to the accuracy of content of the HM Land Registry data and Rightmove does not accept any liability for error or omission. If you have found an error with the data or need further information please contact HM Land Registry.
Permitted Use: Viewers of this Information are granted permission to access this Crown copyright material and to download it onto electronic, magnetic, optical or similar storage media provided that such activities are for private research, study or in-house use only. Any other use of the material requires the formal written permission of Land Registry which can be requested from us, and is subject to an additional licence and associated charge.
Rightmove takes no liability for your use of, or reliance on, Rightmove's Instant Valuation due to the limitations of our tracking tool listed here. Use of this tool is taken entirely at your own risk. All rights reserved.