House Prices in RG2 0NZ
Properties Sold
Flat 306, Peregrine House, Bedwyn Mews, Reading RG2 0NZ
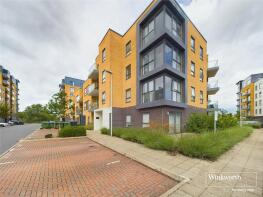
| Today | See what it's worth now |
| 21 Oct 2024 | £317,000 |
| 14 Jun 2018 | £343,500 |
No other historical records.
Flat 3, Peregrine House, Bedwyn Mews, Reading RG2 0NZ
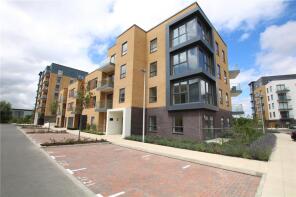
| Today | See what it's worth now |
| 24 Jul 2024 | £222,500 |
| 24 May 2018 | £268,500 |
No other historical records.
Flat 101, Peregrine House, Bedwyn Mews, Reading RG2 0NZ

| Today | See what it's worth now |
| 12 Jan 2024 | £235,000 |
| 20 Jun 2018 | £270,383 |
No other historical records.
Flat 204, Peregrine House, Bedwyn Mews, Reading RG2 0NZ

| Today | See what it's worth now |
| 9 Jun 2023 | £280,000 |
No other historical records.
Flat 205, Peregrine House, Bedwyn Mews, Reading RG2 0NZ
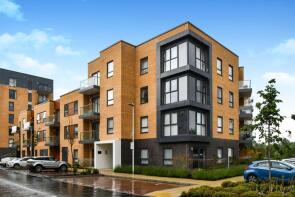
| Today | See what it's worth now |
| 2 Jan 2020 | £228,500 |
| 30 May 2018 | £264,325 |
No other historical records.
Flat 108, Peregrine House, Bedwyn Mews, Reading RG2 0NZ
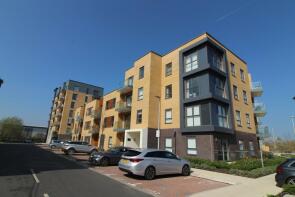
| Today | See what it's worth now |
| 27 Mar 2019 | £305,000 |
No other historical records.
Flat 2, Peregrine House, Bedwyn Mews, Reading RG2 0NZ
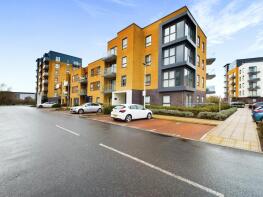
| Today | See what it's worth now |
| 18 Oct 2018 | £315,000 |
No other historical records.
Flat 107, Peregrine House, Bedwyn Mews, Reading RG2 0NZ
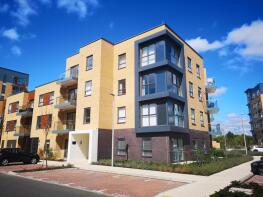
| Today | See what it's worth now |
| 20 Sep 2018 | £260,000 |
No other historical records.
Flat 104, Peregrine House, Bedwyn Mews, Reading RG2 0NZ
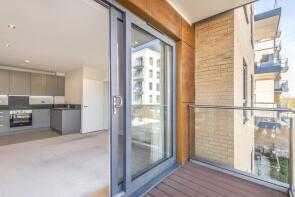
| Today | See what it's worth now |
| 29 Aug 2018 | £330,000 |
No other historical records.
Flat 5, Peregrine House, Bedwyn Mews, Reading RG2 0NZ
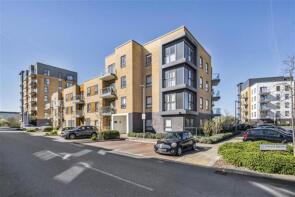
| Today | See what it's worth now |
| 20 Jul 2018 | £288,500 |
No other historical records.
Flat 103, Peregrine House, Bedwyn Mews, Reading RG2 0NZ
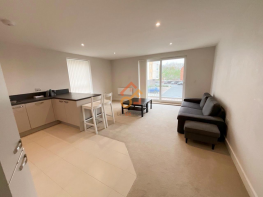
| Today | See what it's worth now |
| 19 Jul 2018 | £278,263 |
No other historical records.
Flat 112, Peregrine House, Bedwyn Mews, Reading RG2 0NZ

| Today | See what it's worth now |
| 16 Jul 2018 | £265,458 |
No other historical records.
Flat 111, Peregrine House, Bedwyn Mews, Reading RG2 0NZ
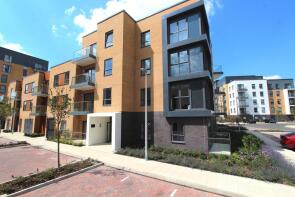
| Today | See what it's worth now |
| 10 Jul 2018 | £266,443 |
No other historical records.
Flat 301, Peregrine House, Bedwyn Mews, Reading RG2 0NZ
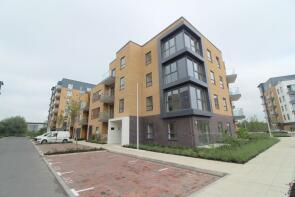
| Today | See what it's worth now |
| 5 Jul 2018 | £265,500 |
No other historical records.
Flat 307, Peregrine House, Bedwyn Mews, Reading RG2 0NZ
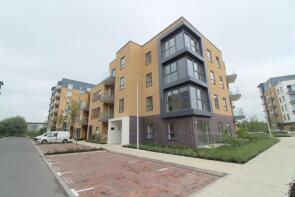
| Today | See what it's worth now |
| 5 Jul 2018 | £358,500 |
No other historical records.
Flat 304, Peregrine House, Bedwyn Mews, Reading RG2 0NZ

| Today | See what it's worth now |
| 5 Jul 2018 | £344,500 |
No other historical records.
Flat 305, Peregrine House, Bedwyn Mews, Reading RG2 0NZ
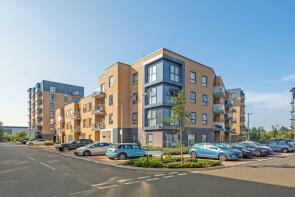
| Today | See what it's worth now |
| 14 Jun 2018 | £275,000 |
No other historical records.
Flat 206, Peregrine House, Bedwyn Mews, Reading RG2 0NZ
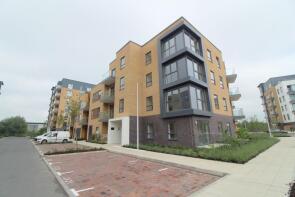
| Today | See what it's worth now |
| 13 Jun 2018 | £341,500 |
No other historical records.
Flat 208, Peregrine House, Bedwyn Mews, Reading RG2 0NZ

| Today | See what it's worth now |
| 8 Jun 2018 | £335,320 |
No other historical records.
Flat 203, Peregrine House, Bedwyn Mews, Reading RG2 0NZ

| Today | See what it's worth now |
| 7 Jun 2018 | £278,760 |
No other historical records.
Flat 201, Peregrine House, Bedwyn Mews, Reading RG2 0NZ
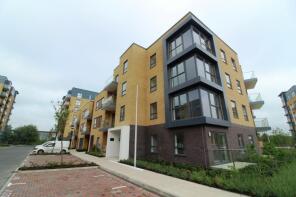
| Today | See what it's worth now |
| 7 Jun 2018 | £262,500 |
No other historical records.
Flat 207, Peregrine House, Bedwyn Mews, Reading RG2 0NZ
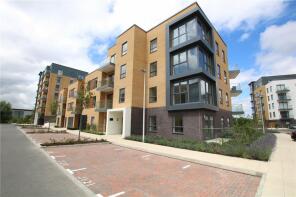
| Today | See what it's worth now |
| 6 Jun 2018 | £261,590 |
No other historical records.
Flat 102, Peregrine House, Bedwyn Mews, Reading RG2 0NZ
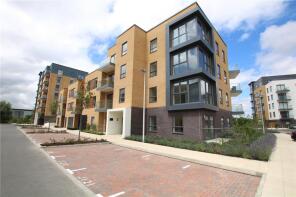
| Today | See what it's worth now |
| 6 Jun 2018 | £265,630 |
No other historical records.
Flat 202, Peregrine House, Bedwyn Mews, Reading RG2 0NZ
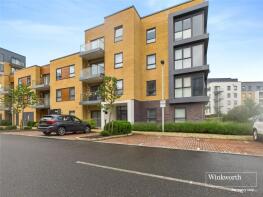
| Today | See what it's worth now |
| 6 Jun 2018 | £263,610 |
No other historical records.
Flat 213, Peregrine House, Bedwyn Mews, Reading RG2 0NZ
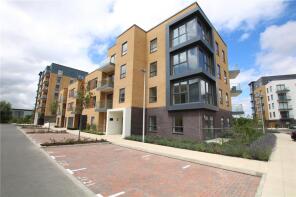
| Today | See what it's worth now |
| 6 Jun 2018 | £276,740 |
No other historical records.
Find out how much your property is worth
The following agents can provide you with a free, no-obligation valuation. Simply select the ones you'd like to hear from.
Sponsored
All featured agents have paid a fee to promote their valuation expertise.

Bespoke Estate Agents
Reading

Davis Tate
Reading

Chancellors
Reading

Roger Platt
Lower Earley

Romans
Reading

Prospect Estate Agency
Reading
Get ready with a Mortgage in Principle
- Personalised result in just 20 minutes
- Find out how much you can borrow
- Get viewings faster with agents
- No impact on your credit score
What's your property worth?
Source Acknowledgement: © Crown copyright. England and Wales house price data is publicly available information produced by the HM Land Registry.This material was last updated on 2 December 2025. It covers the period from 1 January 1995 to 31 October 2025 and contains property transactions which have been registered during that period. Contains HM Land Registry data © Crown copyright and database right 2026. This data is licensed under the Open Government Licence v3.0.
Disclaimer: Rightmove.co.uk provides this HM Land Registry data "as is". The burden for fitness of the data relies completely with the user and is provided for informational purposes only. No warranty, express or implied, is given relating to the accuracy of content of the HM Land Registry data and Rightmove does not accept any liability for error or omission. If you have found an error with the data or need further information please contact HM Land Registry.
Permitted Use: Viewers of this Information are granted permission to access this Crown copyright material and to download it onto electronic, magnetic, optical or similar storage media provided that such activities are for private research, study or in-house use only. Any other use of the material requires the formal written permission of Land Registry which can be requested from us, and is subject to an additional licence and associated charge.
Data on planning applications, home extensions and build costs is provided by Resi.co.uk. Planning data is calculated using the last 2 years of residential applications within the selected planning authority. Home extension data, such as build costs and project timelines, are calculated using approximately 9,000 architectural projects Resi has completed, and 23,500 builders quotes submitted via Resi's platform. Build costs are adjusted according to inflation rates to more accurately represent today's prices.
Map data ©OpenStreetMap contributors.
Rightmove takes no liability for your use of, or reliance on, Rightmove's Instant Valuation due to the limitations of our tracking tool listed here. Use of this tool is taken entirely at your own risk. All rights reserved.

