
House Prices in Handcross Road, Balcombe, Haywards Heath, West Sussex, RH17
House prices in Handcross Road have an overall average of £1,018,750 over the last year.
Overall, the historical sold prices in Handcross Road over the last year were 13% up on the 2022 peak of £901,500.
Properties Sold
1, New England Cottages, Redbridge Lane, Balcombe, Haywards Heath, West Sussex RH17 6JU


| Today | See what it's worth now |
| 3 Jul 2024 | £1,018,750 |
| 5 Dec 2013 | £595,000 |
Wisteria Cottage, Redbridge Lane, Balcombe, Haywards Heath, West Sussex RH17 6JU
| Today | See what it's worth now |
| 16 Feb 2023 | £895,000 |
No other historical records.
2, New England Cottages, Redbridge Lane, Balcombe, Haywards Heath, West Sussex RH17 6JU
| Today | See what it's worth now |
| 29 Sep 2022 | £1,310,000 |
| 12 Aug 2016 | £795,000 |
No other historical records.
The Quest, Handcross Road, Plummers Plain, Horsham, West Sussex RH13 6NX

| Today | See what it's worth now |
| 2 Sep 2022 | £960,000 |
| 24 Apr 2001 | £300,000 |
No other historical records.
3, Holly Cottages, Handcross Road, Staplefield, Haywards Heath, West Sussex RH17 6EF

| Today | See what it's worth now |
| 30 Jun 2022 | £434,500 |
No other historical records.
Silver Birches, Handcross Road, Staplefield, Haywards Heath, West Sussex RH17 6EJ
| Today | See what it's worth now |
| 30 Nov 2021 | £1,030,000 |
| 27 Jul 2001 | £295,000 |
No other historical records.
Homelea, Handcross Road, Plummers Plain, Horsham, West Sussex RH13 6NU
| Today | See what it's worth now |
| 29 Jun 2021 | £950,000 |
| 12 Feb 2016 | £640,000 |
Fir Tree Cottage, Handcross Road, Plummers Plain, Horsham, West Sussex RH13 6NU
| Today | See what it's worth now |
| 15 Jan 2021 | £635,000 |
| 11 Apr 2003 | £295,000 |
No other historical records.
Midwicket, Redbridge Lane, Balcombe, Haywards Heath, West Sussex RH17 6JU
| Today | See what it's worth now |
| 5 Oct 2020 | £1,725,000 |
No other historical records.
Farthings, Handcross Road, Staplefield, Haywards Heath, West Sussex RH17 6EE
| Today | See what it's worth now |
| 8 Sep 2020 | £570,000 |
| 16 Feb 2001 | £705,000 |
No other historical records.
Willow House, Handcross Road, Staplefield, Haywards Heath, West Sussex RH17 6EJ
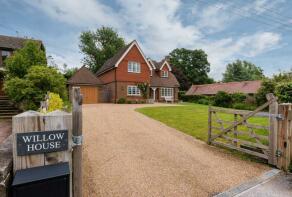
| Today | See what it's worth now |
| 23 Jul 2020 | £890,000 |
| 3 Sep 2014 | £890,000 |
No other historical records.
Brandywell, Handcross Road, Plummers Plain, Horsham, West Sussex RH13 6NU
| Today | See what it's worth now |
| 20 May 2020 | £475,000 |
| 2 Mar 2018 | £455,000 |
Cedars, Staplefield Place, Handcross Road, Staplefield, Haywards Heath, West Sussex RH17 6EG

| Today | See what it's worth now |
| 3 Apr 2020 | £461,007 |
No other historical records.
Cheriton Cottage, Handcross Road, Plummers Plain, Horsham, West Sussex RH13 6NX
| Today | See what it's worth now |
| 28 Feb 2020 | £1,200,000 |
No other historical records.
1, Somerton Cottages, Handcross Road, Staplefield, Haywards Heath, West Sussex RH17 6EF
| Today | See what it's worth now |
| 14 Oct 2019 | £374,000 |
| 21 Feb 2012 | £320,000 |
No other historical records.
2, Council Cottages, Handcross Road, Plummers Plain, Horsham, West Sussex RH13 6NX

| Today | See what it's worth now |
| 15 Aug 2019 | £300,000 |
No other historical records.
Sheiling, Handcross Road, Plummers Plain, Horsham, West Sussex RH13 6NX
| Today | See what it's worth now |
| 30 May 2019 | £1,160,000 |
No other historical records.
Japunji, Handcross Road, Plummers Plain, Horsham, West Sussex RH13 6NX
| Today | See what it's worth now |
| 16 Nov 2018 | £434,500 |
| 26 Jan 2012 | £250,000 |
No other historical records.
Deerhurst, Handcross Road, Plummers Plain, Horsham, West Sussex RH13 6NZ
| Today | See what it's worth now |
| 10 Aug 2018 | £385,000 |
| 20 Dec 2017 | £342,500 |
Meadowcroft, Handcross Road, Plummers Plain, Horsham, West Sussex RH13 6NZ
| Today | See what it's worth now |
| 26 Apr 2018 | £875,000 |
| 20 Jul 1999 | £375,000 |
No other historical records.
2, Holly Cottages, Handcross Road, Staplefield, Haywards Heath, West Sussex RH17 6EF
| Today | See what it's worth now |
| 11 Dec 2017 | £390,000 |
| 6 Aug 2013 | £307,500 |
Wei Ho, Handcross Road, Plummers Plain, Horsham, West Sussex RH13 6NX
| Today | See what it's worth now |
| 29 Sep 2017 | £175,926 |
| 31 Aug 2016 | £425,000 |
No other historical records.
Idmiston, Handcross Road, Plummers Plain, Horsham, West Sussex RH13 6NX
| Today | See what it's worth now |
| 30 Sep 2016 | £632,500 |
| 11 Jul 2001 | £285,000 |
No other historical records.
The Studio, Handcross Road, Staplefield, Haywards Heath, West Sussex RH17 6EE
| Today | See what it's worth now |
| 17 Oct 2013 | £750,000 |
No other historical records.
The Bungalow, Handcross Road, Staplefield, Haywards Heath, West Sussex RH17 6EJ

| Today | See what it's worth now |
| 26 Jun 2013 | £400,000 |
No other historical records.
Find out how much your property is worth
The following agents can provide you with a free, no-obligation valuation. Simply select the ones you'd like to hear from.
Sponsored
All featured agents have paid a fee to promote their valuation expertise.

Brock Taylor
Haywards Heath

Henry Adams
Haywards Heath

Strutt & Parker
Covering Horsham

Savills
Haywards Heath

PSP Homes
Mid Sussex

Fox & Sons
Haywards Heath
Get ready with a Mortgage in Principle
- Personalised result in just 20 minutes
- Find out how much you can borrow
- Get viewings faster with agents
- No impact on your credit score
What's your property worth?
Source Acknowledgement: © Crown copyright. England and Wales house price data is publicly available information produced by the HM Land Registry.This material was last updated on 17 April 2025. It covers the period from 1 January 1995 to 28 February 2025 and contains property transactions which have been registered during that period. Contains HM Land Registry data © Crown copyright and database right 2025. This data is licensed under the Open Government Licence v3.0.
Disclaimer: Rightmove.co.uk provides this HM Land Registry data "as is". The burden for fitness of the data relies completely with the user and is provided for informational purposes only. No warranty, express or implied, is given relating to the accuracy of content of the HM Land Registry data and Rightmove does not accept any liability for error or omission. If you have found an error with the data or need further information please contact HM Land Registry.
Permitted Use: Viewers of this Information are granted permission to access this Crown copyright material and to download it onto electronic, magnetic, optical or similar storage media provided that such activities are for private research, study or in-house use only. Any other use of the material requires the formal written permission of Land Registry which can be requested from us, and is subject to an additional licence and associated charge.
Map data ©OpenStreetMap contributors.
Rightmove takes no liability for your use of, or reliance on, Rightmove's Instant Valuation due to the limitations of our tracking tool listed here. Use of this tool is taken entirely at your own risk. All rights reserved.