
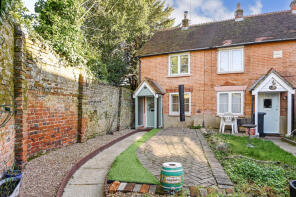
House Prices in Romsey Extra
House prices in Romsey Extra have an overall average of £371,791 over the last year.
The majority of properties sold in Romsey Extra during the last year were flats, selling for an average price of £234,878. Terraced properties sold for an average of £404,028, with semi-detached properties fetching £387,715.
Overall, the historical sold prices in Romsey Extra over the last year were 8% down on the previous year and 6% down on the 2022 peak of £396,392.
Properties Sold
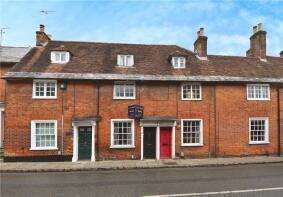
22, Palmerston Street, Romsey SO51 8GG
| Today | See what it's worth now |
| 24 Apr 2026 | £285,000 |
| 8 Jan 2003 | £196,000 |
9, Horsefair House, The Horsefair, Romsey SO51 8LL
| Today | See what it's worth now |
| 20 Apr 2026 | £355,000 |
| 2 Sep 2015 | £300,000 |
No other historical records.
25, Winchester Road, Romsey SO51 8AB

| Today | See what it's worth now |
| 20 Apr 2026 | £475,000 |
| 4 Aug 2017 | £355,000 |
15, Hollman Drive, Romsey SO51 8ES

| Today | See what it's worth now |
| 15 Apr 2026 | £415,000 |
| 14 Jun 2021 | £316,000 |
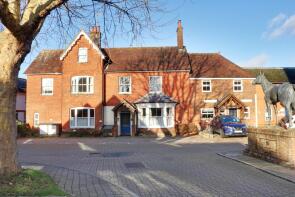
Leeways, Whitenap Lane, Romsey SO51 5RS

| Today | See what it's worth now |
| 14 Apr 2026 | £550,000 |
No other historical records.
30, Abbey Lodge, Bridge Road, Romsey SO51 8LJ
| Today | See what it's worth now |
| 8 Apr 2026 | £240,000 |
| 12 Dec 2014 | £331,950 |
No other historical records.
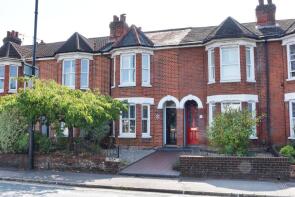
32, Church Lane, Romsey SO51 8EP
| Today | See what it's worth now |
| 2 Apr 2026 | £515,000 |
| 28 Mar 2018 | £395,000 |
77, The Hundred, Romsey SO51 8BZ

| Today | See what it's worth now |
| 2 Apr 2026 | £295,000 |
| 28 Jan 2014 | £225,000 |
48, Mountbatten Avenue, Romsey SO51 8DZ
| Today | See what it's worth now |
| 31 Mar 2026 | £400,000 |
| 20 Feb 2015 | £237,000 |
9, Winchester Road, Romsey SO51 8AB
| Today | See what it's worth now |
| 27 Mar 2026 | £465,000 |
| 19 Jul 2013 | £248,000 |
123, Botley Road, Romsey SO51 5RQ
| Today | See what it's worth now |
| 27 Mar 2026 | £685,000 |
| 14 Nov 2024 | £690,000 |
4, Station Mews, Station Approach, Romsey SO51 8LN
| Today | See what it's worth now |
| 23 Mar 2026 | £270,000 |
| 5 Sep 2025 | £265,000 |
19, Montfort College, Botley Road, Romsey SO51 5PL

| Today | See what it's worth now |
| 20 Mar 2026 | £285,000 |
| 5 Jan 2016 | £245,000 |
129, Tadburn Road, Romsey SO51 5HW

| Today | See what it's worth now |
| 20 Mar 2026 | £368,000 |
| 10 Nov 2017 | £304,000 |
9, Alder Close, Romsey SO51 5SJ
| Today | See what it's worth now |
| 16 Mar 2026 | £420,500 |
| 20 Jan 2022 | £360,600 |
No19 Millstream House, Dukes Mill, Broadwater Road, Romsey SO51 8LB
| Today | See what it's worth now |
| 27 Feb 2026 | £155,000 |
| 25 Jan 2013 | £150,000 |
No other historical records.
23, Wessex Gardens, Romsey SO51 5RD

| Today | See what it's worth now |
| 23 Feb 2026 | £280,000 |
| 25 Sep 2015 | £210,000 |
90, Brewery Lane, Romsey SO51 8JW
| Today | See what it's worth now |
| 20 Feb 2026 | £557,000 |
| 7 Nov 2018 | £425,000 |
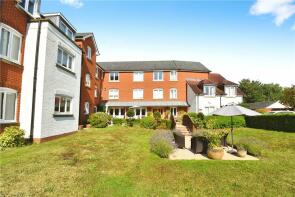
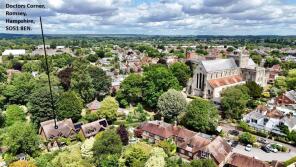
Doctors Corner, The Abbey, Romsey SO51 8EN
| Today | See what it's worth now |
| 17 Feb 2026 | £1,260,000 |
No other historical records.
15, Fleur De Lis, Duttons Road, Romsey SO51 8LH
| Today | See what it's worth now |
| 13 Feb 2026 | £290,000 |
| 8 Jun 2023 | £320,000 |
31, Avon Crescent, Romsey SO51 5PX

| Today | See what it's worth now |
| 13 Feb 2026 | £355,000 |
No other historical records.
65, Knatchbull Close, Romsey SO51 8WJ
| Today | See what it's worth now |
| 12 Feb 2026 | £250,000 |
| 5 Mar 2014 | £191,000 |
No other historical records.
Flat 2, Minden House, Chambers Avenue, Romsey SO51 5FY

| Today | See what it's worth now |
| 11 Feb 2026 | £215,000 |
| 18 Jul 2025 | £155,000 |
No other historical records.
Source Acknowledgement: © Crown copyright. England and Wales house price data is publicly available information produced by the HM Land Registry.This material was last updated on 9 July 2026. It covers the period from 1 January 1995 to 30 April 2026 and contains property transactions which have been registered during that period. Contains HM Land Registry data © Crown copyright and database right 2026. This data is licensed under the Open Government Licence v3.0.
Disclaimer: Rightmove.co.uk provides this HM Land Registry data "as is". The burden for fitness of the data relies completely with the user and is provided for informational purposes only. No warranty, express or implied, is given relating to the accuracy of content of the HM Land Registry data and Rightmove does not accept any liability for error or omission. If you have found an error with the data or need further information please contact HM Land Registry.
Permitted Use: Viewers of this Information are granted permission to access this Crown copyright material and to download it onto electronic, magnetic, optical or similar storage media provided that such activities are for private research, study or in-house use only. Any other use of the material requires the formal written permission of Land Registry which can be requested from us, and is subject to an additional licence and associated charge.
Rightmove takes no liability for your use of, or reliance on, Rightmove's Instant Valuation due to the limitations of our tracking tool listed here. Use of this tool is taken entirely at your own risk. All rights reserved.