
House Prices in Sharston
House prices in Sharston have an overall average of £234,223 over the last year.
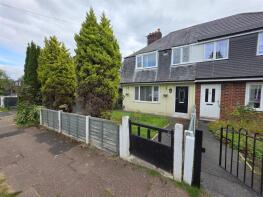
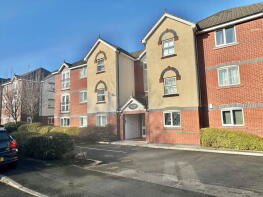
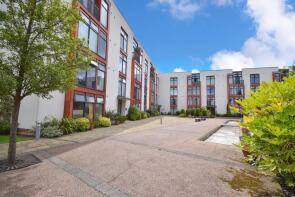
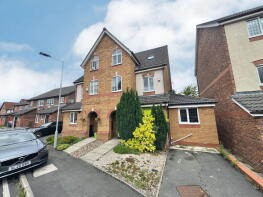
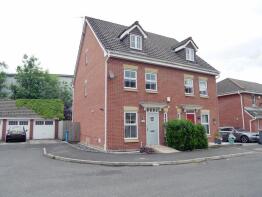
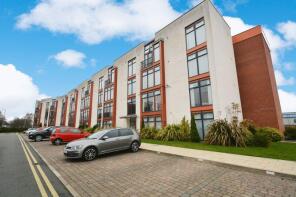
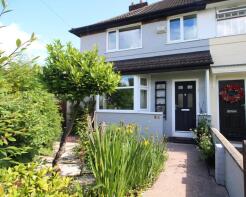
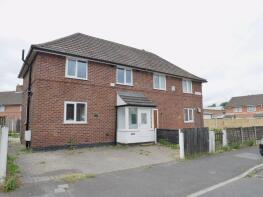
The majority of properties sold in Sharston during the last year were semi-detached properties, selling for an average price of £279,022. Flats sold for an average of £155,344, with terraced properties fetching £234,375.
Overall, the historical sold prices in Sharston over the last year were 10% up on the previous year and 6% up on the 2023 peak of £220,632.
Properties Sold
25, Rotherby Road, Manchester M22 4GS
| Today | See what it's worth now |
| 20 Feb 2026 | £242,000 |
| 27 Jun 2014 | £85,500 |
No other historical records.
Flat 7, 2, Downes Way, Manchester M22 4UD
| Today | See what it's worth now |
| 19 Feb 2026 | £140,000 |
| 27 Aug 2004 | £121,000 |
Apartment 27, 1 Crown House, Lauriston Close, Manchester M22 4TZ
| Today | See what it's worth now |
| 23 Jan 2026 | £154,000 |
| 1 Jul 2014 | £121,000 |
41, Northumberland Way, Manchester M22 4UG
| Today | See what it's worth now |
| 9 Jan 2026 | £332,000 |
| 30 Sep 2021 | £288,000 |
4, Oakcroft Way, Manchester M22 4UP


| Today | See what it's worth now |
| 5 Jan 2026 | £83,499 |
| 16 Dec 2011 | £195,000 |
Flat 21, 196, Altrincham Road, Manchester M22 4RZ

| Today | See what it's worth now |
| 19 Dec 2025 | £165,000 |
| 14 Aug 2015 | £121,000 |
20, Edgecote Close, Manchester M22 4UT
| Today | See what it's worth now |
| 18 Dec 2025 | £338,000 |
| 28 Jul 2014 | £198,750 |
45, 2 Beech House, Lauriston Close, Manchester M22 4TZ
| Today | See what it's worth now |
| 8 Dec 2025 | £165,000 |
| 29 Mar 2018 | £150,000 |
13, Briar Crescent, Manchester M22 4QU
| Today | See what it's worth now |
| 5 Dec 2025 | £220,000 |
| 18 Oct 1996 | £25,000 |
No other historical records.
4, Norwell Road, Manchester M22 4PL
| Today | See what it's worth now |
| 5 Dec 2025 | £220,000 |
| 14 Jan 2014 | £85,000 |
No other historical records.
45, Hilton Road, Manchester M22 4ZD
| Today | See what it's worth now |
| 1 Dec 2025 | £400,000 |
| 6 Oct 2017 | £190,000 |
30, Barncroft Gardens, Manchester M22 8LZ
| Today | See what it's worth now |
| 25 Nov 2025 | £231,000 |
| 19 Apr 2021 | £158,000 |
46, Royalthorn Road, Manchester M22 8AD
| Today | See what it's worth now |
| 24 Nov 2025 | £274,000 |
| 12 Sep 2023 | £165,000 |
Apartment 15, 1 Crown House, Lauriston Close, Manchester M22 4TZ

| Today | See what it's worth now |
| 20 Nov 2025 | £152,000 |
| 13 Dec 2007 | £142,950 |
No other historical records.
16, Goldcrest Close, Manchester M22 4WU
| Today | See what it's worth now |
| 19 Nov 2025 | £300,000 |
| 19 Apr 2006 | £142,500 |
115, Woodhouse Lane, Benchill, Manchester M22 8JX
| Today | See what it's worth now |
| 11 Nov 2025 | £250,000 |
| 9 Dec 2015 | £114,950 |
No other historical records.
31, Boothfield Road, Manchester M22 8AT
| Today | See what it's worth now |
| 7 Nov 2025 | £245,000 |
| 22 Mar 2017 | £123,000 |
No other historical records.
7, Finchwood Road, Manchester M22 4UW
| Today | See what it's worth now |
| 31 Oct 2025 | £255,000 |
| 24 Jun 2022 | £250,000 |
Flat 17, 1a Crown House, Freshpool Way, Manchester M22 4UB
| Today | See what it's worth now |
| 30 Oct 2025 | £155,000 |
| 23 May 2008 | £134,920 |
No other historical records.
32, Alderue Avenue, Manchester M22 8DW
| Today | See what it's worth now |
| 30 Oct 2025 | £225,000 |
| 9 Mar 2005 | £99,950 |
44, Woodhouse Lane, Benchill, Manchester M22 8JT
| Today | See what it's worth now |
| 24 Oct 2025 | £252,500 |
No other historical records.
2, Halstead Grove, Gatley, Cheadle SK8 4HL
| Today | See what it's worth now |
| 22 Oct 2025 | £320,000 |
| 16 Aug 2023 | £325,000 |
No other historical records.
Flat 6, 1a Crown House, Freshpool Way, Manchester M22 4UB
| Today | See what it's worth now |
| 20 Oct 2025 | £155,000 |
| 11 Apr 2008 | £146,500 |
No other historical records.
Flat 2, 171, Greenwood Road, Manchester M22 8BF
| Today | See what it's worth now |
| 17 Oct 2025 | £155,000 |
| 30 Mar 2007 | £140,000 |
No other historical records.
20, Halstead Grove, Gatley, Cheadle SK8 4HL
| Today | See what it's worth now |
| 17 Oct 2025 | £295,000 |
No other historical records.
Source Acknowledgement: © Crown copyright. England and Wales house price data is publicly available information produced by the HM Land Registry.This material was last updated on 9 April 2026. It covers the period from 1 January 1995 to 27 February 2026 and contains property transactions which have been registered during that period. Contains HM Land Registry data © Crown copyright and database right 2026. This data is licensed under the Open Government Licence v3.0.
Disclaimer: Rightmove.co.uk provides this HM Land Registry data "as is". The burden for fitness of the data relies completely with the user and is provided for informational purposes only. No warranty, express or implied, is given relating to the accuracy of content of the HM Land Registry data and Rightmove does not accept any liability for error or omission. If you have found an error with the data or need further information please contact HM Land Registry.
Permitted Use: Viewers of this Information are granted permission to access this Crown copyright material and to download it onto electronic, magnetic, optical or similar storage media provided that such activities are for private research, study or in-house use only. Any other use of the material requires the formal written permission of Land Registry which can be requested from us, and is subject to an additional licence and associated charge.
Map data ©OpenStreetMap contributors.
Rightmove takes no liability for your use of, or reliance on, Rightmove's Instant Valuation due to the limitations of our tracking tool listed here. Use of this tool is taken entirely at your own risk. All rights reserved.