
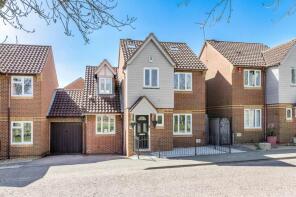
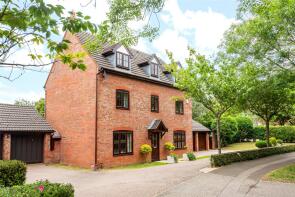
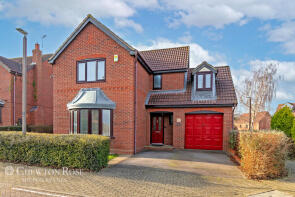
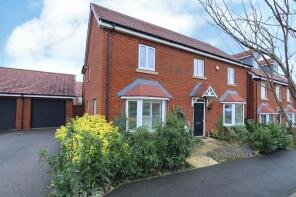
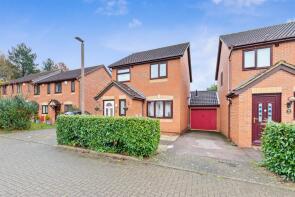
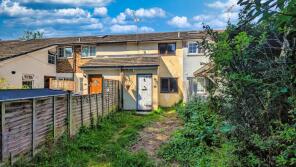
House Prices in Shenley Brook End
House prices in Shenley Brook End have an overall average of £472,548 over the last year.
The majority of properties sold in Shenley Brook End during the last year were detached properties, selling for an average price of £542,346. Semi-detached properties sold for an average of £369,000, with terraced properties fetching £290,000.
Overall, the historical sold prices in Shenley Brook End over the last year were 2% down on the previous year and 14% down on the 2022 peak of £546,300.
Properties Sold
1, Chartley Court, Shenley Brook End, Milton Keynes MK5 7HJ
| Today | See what it's worth now |
| 16 Apr 2026 | £305,000 |
| 3 Oct 2005 | £149,000 |
No other historical records.
11, Braford Gardens, Shenley Brook End, Milton Keynes MK5 7HY
| Today | See what it's worth now |
| 30 Mar 2026 | £625,000 |
| 12 May 2022 | £510,000 |
70, Garthwaite Crescent, Shenley Brook End, Milton Keynes MK5 7AX
| Today | See what it's worth now |
| 27 Mar 2026 | £530,000 |
| 25 Oct 1999 | £187,500 |
No other historical records.
39, Egerton Gate, Shenley Brook End, Milton Keynes MK5 7HH
| Today | See what it's worth now |
| 25 Mar 2026 | £520,000 |
| 28 Nov 1995 | £109,995 |
No other historical records.
50, Braford Gardens, Shenley Brook End, Milton Keynes MK5 7HY
| Today | See what it's worth now |
| 2 Mar 2026 | £327,000 |
| 31 May 1996 | £60,000 |
No other historical records.
23, Braford Gardens, Shenley Brook End, Milton Keynes MK5 7HY
| Today | See what it's worth now |
| 25 Feb 2026 | £435,000 |
| 4 Dec 1996 | £97,995 |
No other historical records.
18, Cranwell Close, Shenley Brook End, Milton Keynes MK5 7BU
| Today | See what it's worth now |
| 24 Feb 2026 | £385,000 |
| 31 Aug 2005 | £194,000 |
6, Bremen Grove, Shenley Brook End, Milton Keynes MK5 7FJ
| Today | See what it's worth now |
| 12 Feb 2026 | £415,000 |
| 26 Nov 1999 | £110,000 |
24, Plantation Place, Shenley Brook End, Milton Keynes MK5 7FP
| Today | See what it's worth now |
| 11 Feb 2026 | £625,000 |
| 26 Oct 2020 | £535,001 |
16, Berkshire Green, Shenley Brook End, Milton Keynes MK5 7FL
| Today | See what it's worth now |
| 6 Feb 2026 | £580,000 |
| 17 Mar 2016 | £380,000 |
42, Braford Gardens, Shenley Brook End, Milton Keynes MK5 7HY
| Today | See what it's worth now |
| 6 Feb 2026 | £490,000 |
| 3 Jul 2003 | £247,000 |
22, Cressey Avenue, Shenley Brook End, Milton Keynes MK5 7EL
| Today | See what it's worth now |
| 19 Dec 2025 | £355,000 |
| 28 Mar 2003 | £162,000 |
15, Angora Close, Shenley Brook End, Milton Keynes MK5 7GJ
| Today | See what it's worth now |
| 15 Dec 2025 | £627,500 |
| 16 Aug 2019 | £490,000 |
69, Cressey Avenue, Shenley Brook End, Milton Keynes MK5 7EL

| Today | See what it's worth now |
| 26 Nov 2025 | £290,000 |
| 6 Jul 2012 | £153,500 |
6, Egerton Gate, Shenley Brook End, Milton Keynes MK5 7HH
| Today | See what it's worth now |
| 6 Nov 2025 | £450,000 |
| 30 May 2001 | £138,000 |
73, Cressey Avenue, Shenley Brook End, Milton Keynes MK5 7EL
| Today | See what it's worth now |
| 3 Nov 2025 | £295,000 |
| 24 Mar 2017 | £240,000 |
22, Minorca Grove, Shenley Brook End, Milton Keynes MK5 7FU
| Today | See what it's worth now |
| 8 Oct 2025 | £485,000 |
| 26 Oct 2001 | £204,995 |
No other historical records.
51, Cressey Avenue, Shenley Brook End, Milton Keynes MK5 7EL
| Today | See what it's worth now |
| 8 Oct 2025 | £541,000 |
| 14 Aug 2009 | £180,000 |
No other historical records.
51, Walbank Grove, Shenley Brook End, Milton Keynes MK5 7GD
| Today | See what it's worth now |
| 22 Sep 2025 | £783,000 |
| 31 May 2001 | £249,950 |
No other historical records.
7, Welsummer Grove, Shenley Brook End, Milton Keynes MK5 7GE
| Today | See what it's worth now |
| 11 Jul 2025 | £550,000 |
| 5 Apr 2023 | £535,000 |
6, Welsummer Grove, Shenley Brook End, Milton Keynes MK5 7GE
| Today | See what it's worth now |
| 1 Jul 2025 | £310,000 |
| 19 Dec 2003 | £149,950 |
No other historical records.
3, Brices Meadow, Shenley Brook End, Milton Keynes MK5 7HB

| Today | See what it's worth now |
| 30 Jun 2025 | £580,000 |
| 11 Nov 2022 | £558,000 |
1, Greylag Gardens, Shenley Brook End, Milton Keynes MK5 7GX
| Today | See what it's worth now |
| 27 Jun 2025 | £740,000 |
| 8 May 2015 | £460,000 |
No other historical records.
Source Acknowledgement: © Crown copyright. England and Wales house price data is publicly available information produced by the HM Land Registry.This material was last updated on 9 July 2026. It covers the period from 1 January 1995 to 30 April 2026 and contains property transactions which have been registered during that period. Contains HM Land Registry data © Crown copyright and database right 2026. This data is licensed under the Open Government Licence v3.0.
Disclaimer: Rightmove.co.uk provides this HM Land Registry data "as is". The burden for fitness of the data relies completely with the user and is provided for informational purposes only. No warranty, express or implied, is given relating to the accuracy of content of the HM Land Registry data and Rightmove does not accept any liability for error or omission. If you have found an error with the data or need further information please contact HM Land Registry.
Permitted Use: Viewers of this Information are granted permission to access this Crown copyright material and to download it onto electronic, magnetic, optical or similar storage media provided that such activities are for private research, study or in-house use only. Any other use of the material requires the formal written permission of Land Registry which can be requested from us, and is subject to an additional licence and associated charge.
Rightmove takes no liability for your use of, or reliance on, Rightmove's Instant Valuation due to the limitations of our tracking tool listed here. Use of this tool is taken entirely at your own risk. All rights reserved.