
House Prices in SN11
House prices in SN11 have an overall average of £325,805 over the last year.
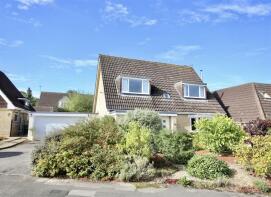
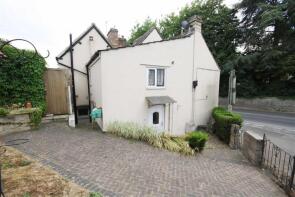
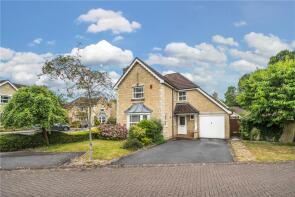
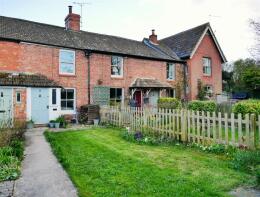
The majority of properties sold in SN11 during the last year were detached properties, selling for an average price of £468,188. Terraced properties sold for an average of £242,077, with semi-detached properties fetching £309,110.
Overall, the historical sold prices in SN11 over the last year were 2% up on the previous year and 1% up on the 2022 peak of £321,717.
Properties Sold
47, Church Road, Derry Hill, Calne, Wiltshire SN11 9NR
| Today | See what it's worth now |
| 13 Feb 2025 | £610,000 |
| 16 Jun 2017 | £431,500 |
8, Riverside, Calne, Wiltshire SN11 0LF
| Today | See what it's worth now |
| 3 Feb 2025 | £472,500 |
| 13 Sep 2019 | £425,000 |
15, Highgrove Close, Calne, Wiltshire SN11 8NF
| Today | See what it's worth now |
| 3 Feb 2025 | £196,000 |
| 7 Jan 2016 | £135,000 |
15, Harrier Close, Calne, Wiltshire SN11 9UT


| Today | See what it's worth now |
| 31 Jan 2025 | £143,000 |
| 17 Nov 2006 | £110,000 |
16, Ebor Gardens, Calne, Wiltshire SN11 0AJ
| Today | See what it's worth now |
| 31 Jan 2025 | £397,400 |
| 21 Jul 2000 | £160,000 |
No other historical records.
7, Hungerford Road, Calne, Wiltshire SN11 9BQ
| Today | See what it's worth now |
| 31 Jan 2025 | £290,000 |
| 28 Oct 2022 | £281,000 |
44, Falstaff Court, King Edward Close, Calne, Wiltshire SN11 9RG

| Today | See what it's worth now |
| 31 Jan 2025 | £238,000 |
| 4 Oct 2013 | £145,000 |
20, Park Close, Calne, Wiltshire SN11 8LU
| Today | See what it's worth now |
| 30 Jan 2025 | £276,000 |
| 13 Jul 2018 | £220,000 |
39, Nuthatch Road, Calne, Wiltshire SN11 9SH

| Today | See what it's worth now |
| 24 Jan 2025 | £343,000 |
| 8 Jun 2016 | £247,500 |
14, Comet Crescent, Calne, Wiltshire SN11 8FT
| Today | See what it's worth now |
| 24 Jan 2025 | £350,000 |
| 9 Mar 2012 | £219,995 |
No other historical records.
Bramble House, Church Road, Derry Hill, Calne, Wiltshire SN11 9NS
| Today | See what it's worth now |
| 23 Jan 2025 | £705,000 |
| 22 Jul 2016 | £615,000 |
7, Lansdowne Crescent, Derry Hill, Calne, Wiltshire SN11 9NT
| Today | See what it's worth now |
| 23 Jan 2025 | £530,000 |
| 25 Sep 2008 | £322,500 |
No other historical records.
37, Quemerford, Calne, Wiltshire SN11 8JR
| Today | See what it's worth now |
| 20 Jan 2025 | £343,000 |
| 3 Apr 2017 | £257,000 |
14, Petty Lane, Derry Hill, Calne, Wiltshire SN11 9QY
| Today | See what it's worth now |
| 20 Jan 2025 | £420,000 |
| 28 May 1999 | £135,000 |
No other historical records.
Glebe House, Hilmarton, Calne, Wiltshire SN11 8SB

| Today | See what it's worth now |
| 17 Jan 2025 | £630,000 |
| 8 Mar 1995 | £117,000 |
No other historical records.
3, Blackland Crossroads, Blackland, Calne, Wiltshire SN11 8PU
| Today | See what it's worth now |
| 14 Jan 2025 | £265,000 |
| 10 Mar 2017 | £228,000 |
2, Dixon Way, Calne, Wiltshire SN11 9AJ
| Today | See what it's worth now |
| 10 Jan 2025 | £270,000 |
| 9 Oct 2020 | £195,000 |
No other historical records.
31, Saffron Meadow, Calne, Wiltshire SN11 0RR
| Today | See what it's worth now |
| 3 Jan 2025 | £325,000 |
| 22 May 2012 | £197,500 |
No other historical records.
25, Petty Lane, Derry Hill, Calne, Wiltshire SN11 9QY
| Today | See what it's worth now |
| 3 Jan 2025 | £595,000 |
| 29 Jul 1999 | £182,000 |
No other historical records.
65, Woodroffe Square, Calne, Wiltshire SN11 8PW

| Today | See what it's worth now |
| 20 Dec 2024 | £77,500 |
No other historical records.
20, Castle Street, Calne, Wiltshire SN11 0DX
| Today | See what it's worth now |
| 20 Dec 2024 | £232,500 |
| 6 May 2022 | £230,000 |
8, Anson Avenue, Calne, Wiltshire SN11 8FU

| Today | See what it's worth now |
| 20 Dec 2024 | £312,000 |
| 14 Aug 2014 | £203,000 |
No other historical records.
20, Magnolia Rise, Calne, Wiltshire SN11 0QP
| Today | See what it's worth now |
| 19 Dec 2024 | £140,000 |
| 19 May 2006 | £98,000 |
Sauveurs Coach House, High Penn, Calne, Wiltshire SN11 8RU

| Today | See what it's worth now |
| 19 Dec 2024 | £950,000 |
| 24 Jan 2014 | £525,000 |
48, Anson Avenue, Calne, Wiltshire SN11 8FU
| Today | See what it's worth now |
| 18 Dec 2024 | £217,000 |
| 12 Jul 2023 | £222,500 |
Find out how much your property is worth
The following agents can provide you with a free, no-obligation valuation. Simply select the ones you'd like to hear from.
Sponsored
All featured agents have paid a fee to promote their valuation expertise.

Richard James
Royal Wootton Bassett

Atwell Martin
Calne

Winkworth
Marlborough

Butfield Breach
Calne

Allen & Harris
Calne

Charles Faye Estate Agents
Calne
Get ready with a Mortgage in Principle
- Personalised result in just 20 minutes
- Find out how much you can borrow
- Get viewings faster with agents
- No impact on your credit score
What's your property worth?
House prices near SN11
Source Acknowledgement: © Crown copyright. England and Wales house price data is publicly available information produced by the HM Land Registry.This material was last updated on 17 April 2025. It covers the period from 1 January 1995 to 28 February 2025 and contains property transactions which have been registered during that period. Contains HM Land Registry data © Crown copyright and database right 2025. This data is licensed under the Open Government Licence v3.0.
Disclaimer: Rightmove.co.uk provides this HM Land Registry data "as is". The burden for fitness of the data relies completely with the user and is provided for informational purposes only. No warranty, express or implied, is given relating to the accuracy of content of the HM Land Registry data and Rightmove does not accept any liability for error or omission. If you have found an error with the data or need further information please contact HM Land Registry.
Permitted Use: Viewers of this Information are granted permission to access this Crown copyright material and to download it onto electronic, magnetic, optical or similar storage media provided that such activities are for private research, study or in-house use only. Any other use of the material requires the formal written permission of Land Registry which can be requested from us, and is subject to an additional licence and associated charge.
Map data ©OpenStreetMap contributors.
Rightmove takes no liability for your use of, or reliance on, Rightmove's Instant Valuation due to the limitations of our tracking tool listed here. Use of this tool is taken entirely at your own risk. All rights reserved.