House Prices in Lower Richmond Road, Wandsworth, London, SW15
House prices in Lower Richmond Road have an overall average of £672,173 over the last year.
The majority of properties sold in Lower Richmond Road during the last year were flats, selling for an average price of £680,750. Terraced properties sold for an average of £569,250.
Overall, the historical sold prices in Lower Richmond Road over the last year were 19% down on the previous year and 16% down on the 2016 peak of £797,763.
Properties Sold
86, Kenilworth Court, Lower Richmond Road, London SW15 1HA

| Today | See what it's worth now |
| 31 Mar 2025 | £817,500 |
| 31 Jul 2019 | £671,000 |
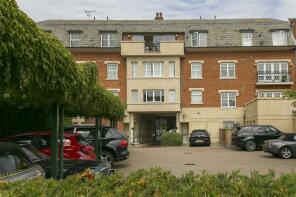
3, 135 Griffin Gate, Lower Richmond Road, London SW15 1EZ
| Today | See what it's worth now |
| 27 Mar 2025 | £435,000 |
| 28 Jun 2011 | £345,000 |
199b, Lower Richmond Road, London SW15 1HJ

| Today | See what it's worth now |
| 4 Feb 2025 | £445,000 |
No other historical records.
46a, Lower Richmond Road, London SW15 1JP

| Today | See what it's worth now |
| 27 Jan 2025 | £530,000 |
| 11 May 2018 | £499,999 |
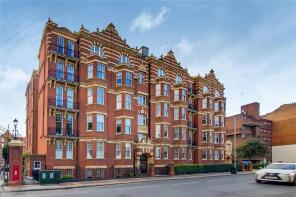
13, Kenilworth Court, Lower Richmond Road, London SW15 1EW
| Today | See what it's worth now |
| 19 Dec 2024 | £1,000,000 |
| 29 Sep 2016 | £925,000 |
Flat First Floor 2, 122, Lower Richmond Road, London SW15 1LN

| Today | See what it's worth now |
| 18 Dec 2024 | £495,000 |
| 31 Aug 2018 | £449,500 |
No other historical records.
Maisonette First And Second Floors A, 163, Lower Richmond Road, London SW15 1HH

| Today | See what it's worth now |
| 13 Dec 2024 | £700,000 |
| 31 Mar 2016 | £613,013 |
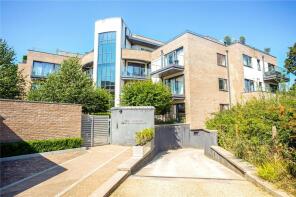
1, 186 Henry Chester Building, Lower Richmond Road, London SW15 1LY
| Today | See what it's worth now |
| 27 Sep 2024 | £760,000 |
| 1 Sep 2017 | £825,000 |
No other historical records.
78, Kenilworth Court, Lower Richmond Road, London SW15 1EN
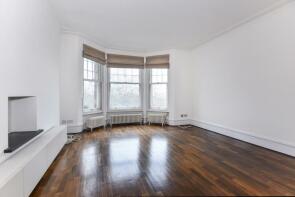
| Today | See what it's worth now |
| 27 Aug 2024 | £975,000 |
| 8 Jan 1998 | £235,000 |
No other historical records.
2, 135 Griffin Gate, Lower Richmond Road, London SW15 1EZ

| Today | See what it's worth now |
| 19 Aug 2024 | £1,000,000 |
| 31 Mar 2014 | £797,000 |
Flat Ground Floor, 67, Lower Richmond Road, London SW15 1ET
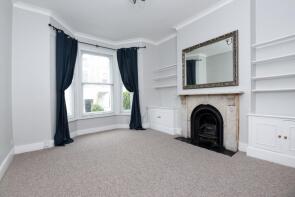
| Today | See what it's worth now |
| 16 Aug 2024 | £390,000 |
| 11 Dec 2020 | £375,000 |
176, Lower Richmond Road, London SW15 1LY

| Today | See what it's worth now |
| 5 Aug 2024 | £569,250 |
| 13 Jun 2014 | £476,000 |
Flat Ground Floor, 165, Lower Richmond Road, London SW15 1HH

| Today | See what it's worth now |
| 1 Aug 2024 | £621,500 |
| 31 Jul 2018 | £675,000 |
5, 135 Griffin Gate, Lower Richmond Road, London SW15 1EZ

| Today | See what it's worth now |
| 16 Jul 2024 | £595,000 |
| 30 Aug 2013 | £525,000 |
Flat First Floor, 88, Lower Richmond Road, London SW15 1LL

| Today | See what it's worth now |
| 15 Jul 2024 | £355,000 |
| 3 Jun 2005 | £245,000 |
Maisonette First And Second Floors A, 54, Lower Richmond Road, London SW15 1JT

| Today | See what it's worth now |
| 31 May 2024 | £909,500 |
| 11 Nov 2004 | £565,000 |
No other historical records.
Flat 3, 125a, Lower Richmond Road, London SW15 1EX

| Today | See what it's worth now |
| 11 Apr 2024 | £800,000 |
No other historical records.
Flat First Floor, 117, Lower Richmond Road, London SW15 1EX

| Today | See what it's worth now |
| 19 Mar 2024 | £480,000 |
| 24 Nov 2004 | £265,000 |
13, 6 Star And Garter Mansions, Lower Richmond Road, London SW15 1JW

| Today | See what it's worth now |
| 19 Feb 2024 | £702,000 |
No other historical records.
Flat Ground Floor, 109, Lower Richmond Road, London SW15 1EU

| Today | See what it's worth now |
| 8 Feb 2024 | £625,000 |
| 20 Jan 2014 | £524,000 |
100a, Lower Richmond Road, London SW15 1LN

| Today | See what it's worth now |
| 2 Nov 2023 | £990,000 |
| 3 Aug 2018 | £830,000 |
73, Lower Richmond Road, London SW15 1ET

| Today | See what it's worth now |
| 31 Oct 2023 | £1,540,000 |
No other historical records.
66, Kenilworth Court, Lower Richmond Road, London SW15 1EN
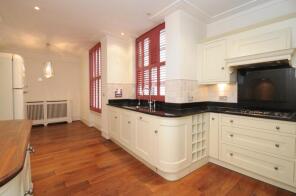
| Today | See what it's worth now |
| 17 Oct 2023 | £945,000 |
| 19 Aug 2013 | £820,000 |
No other historical records.
134, Lower Richmond Road, London SW15 1LU
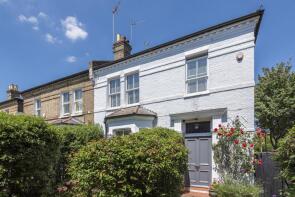
| Today | See what it's worth now |
| 15 Aug 2023 | £1,900,000 |
No other historical records.
102, Lower Richmond Road, London SW15 1LN

| Today | See what it's worth now |
| 28 Jul 2023 | £700,000 |
| 7 Jul 2005 | £465,000 |
Find out how much your property is worth
The following agents can provide you with a free, no-obligation valuation. Simply select the ones you'd like to hear from.
Sponsored
All featured agents have paid a fee to promote their valuation expertise.

Foxtons
Putney

Hamptons
Putney

Stirling Ackroyd Sales
Putney

Knight Frank
Wimbledon

Chartwell Residential
London

James Anderson
Putney - Sales
Get ready with a Mortgage in Principle
- Personalised result in just 20 minutes
- Find out how much you can borrow
- Get viewings faster with agents
- No impact on your credit score
What's your property worth?
House prices near Lower Richmond Road
Source Acknowledgement: © Crown copyright. England and Wales house price data is publicly available information produced by the HM Land Registry.This material was last updated on 16 July 2025. It covers the period from 1 January 1995 to 30 May 2025 and contains property transactions which have been registered during that period. Contains HM Land Registry data © Crown copyright and database right 2025. This data is licensed under the Open Government Licence v3.0.
Disclaimer: Rightmove.co.uk provides this HM Land Registry data "as is". The burden for fitness of the data relies completely with the user and is provided for informational purposes only. No warranty, express or implied, is given relating to the accuracy of content of the HM Land Registry data and Rightmove does not accept any liability for error or omission. If you have found an error with the data or need further information please contact HM Land Registry.
Permitted Use: Viewers of this Information are granted permission to access this Crown copyright material and to download it onto electronic, magnetic, optical or similar storage media provided that such activities are for private research, study or in-house use only. Any other use of the material requires the formal written permission of Land Registry which can be requested from us, and is subject to an additional licence and associated charge.
Data on planning applications, home extensions and build costs is provided by Resi.co.uk. Planning data is calculated using the last 2 years of residential applications within the selected planning authority. Home extension data, such as build costs and project timelines, are calculated using approximately 9,000 architectural projects Resi has completed, and 23,500 builders quotes submitted via Resi's platform. Build costs are adjusted according to inflation rates to more accurately represent today's prices.
Map data ©OpenStreetMap contributors.
Rightmove takes no liability for your use of, or reliance on, Rightmove's Instant Valuation due to the limitations of our tracking tool listed here. Use of this tool is taken entirely at your own risk. All rights reserved.

