
House Prices in Theydon Grove
House prices in Theydon Grove have an overall average of £556,712 over the last year.
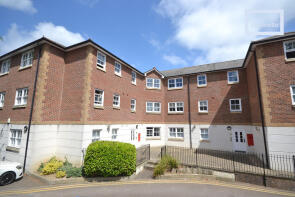
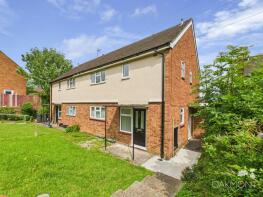
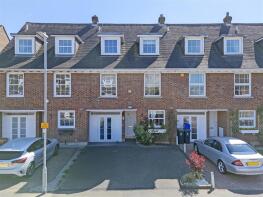
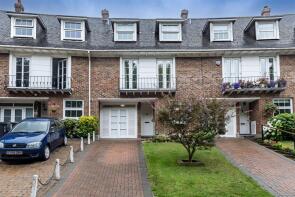
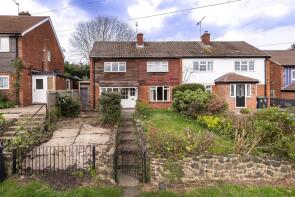
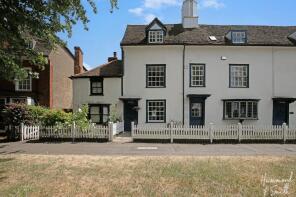
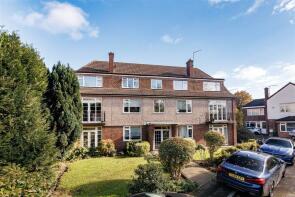
The majority of properties sold in Theydon Grove during the last year were flats, selling for an average price of £351,333. Terraced properties sold for an average of £669,250, with semi-detached properties fetching £607,800.
Overall, the historical sold prices in Theydon Grove over the last year were 14% down on the previous year and 15% down on the 2022 peak of £652,042.
Properties Sold
88, Hemnall Street, Epping CM16 4LY

| Today | See what it's worth now |
| 30 Mar 2026 | £610,000 |
| 10 Dec 2020 | £515,000 |
26, 25 36, Woodland Grove, Epping CM16 4NE
| Today | See what it's worth now |
| 26 Feb 2026 | £300,000 |
| 3 Feb 2016 | £295,000 |
61, Centre Drive, Epping CM16 4JF
| Today | See what it's worth now |
| 25 Feb 2026 | £525,000 |
No other historical records.
149, Theydon Grove, Epping CM16 4QB
| Today | See what it's worth now |
| 18 Feb 2026 | £820,000 |
| 23 Jan 2015 | £590,000 |
73, Centre Drive, Epping CM16 4JF

| Today | See what it's worth now |
| 16 Feb 2026 | £572,000 |
| 11 Dec 2009 | £331,000 |
Flat 8, Tennyson House, Addison Court, Epping CM16 4FF
| Today | See what it's worth now |
| 12 Feb 2026 | £346,000 |
| 2 May 2001 | £138,695 |
No other historical records.
36, Centre Drive, Epping CM16 4JF
| Today | See what it's worth now |
| 19 Jan 2026 | £612,000 |
| 23 Jul 2018 | £517,500 |
No other historical records.
Stoneleigh, Hemnall Street, Epping CM16 4LR
| Today | See what it's worth now |
| 19 Dec 2025 | £565,000 |
No other historical records.
23, Kendal Avenue, Epping CM16 4PP
| Today | See what it's worth now |
| 11 Dec 2025 | £800,000 |
| 8 Aug 2006 | £490,000 |
37, Amesbury Close, Epping CM16 4JA

| Today | See what it's worth now |
| 11 Dec 2025 | £360,000 |
| 17 Dec 2006 | £162,000 |
No other historical records.
17a Magnolia Cottage, Ivy Chimneys, Epping CM16 4EL
| Today | See what it's worth now |
| 8 Dec 2025 | £810,000 |
| 19 Sep 2002 | £426,451 |
No other historical records.
11, Hemnall Mews, Hemnall Street, Epping CM16 4LJ
| Today | See what it's worth now |
| 5 Dec 2025 | £367,500 |
| 12 May 2017 | £360,000 |
11a, Springfield, Epping CM16 4LA
| Today | See what it's worth now |
| 24 Nov 2025 | £255,000 |
No other historical records.
72, Theydon Grove, Epping CM16 4QA
| Today | See what it's worth now |
| 24 Nov 2025 | £818,500 |
| 29 Aug 2001 | £289,950 |
88, Theydon Grove, Epping CM16 4QA
| Today | See what it's worth now |
| 21 Nov 2025 | £885,000 |
| 12 Dec 2014 | £590,000 |
No other historical records.
22, Pine View Manor, Hartland Road, Epping CM16 4PB
| Today | See what it's worth now |
| 31 Oct 2025 | £340,000 |
| 14 Nov 1996 | £76,000 |
No other historical records.
6, 134a Empire House, High Street, Epping CM16 4AG

| Today | See what it's worth now |
| 27 Oct 2025 | £375,000 |
| 23 Oct 2015 | £355,000 |
No other historical records.
Flat 1, Tennyson House, Addison Court, Epping CM16 4FF
| Today | See what it's worth now |
| 26 Sep 2025 | £337,500 |
| 19 Jul 2019 | £322,000 |
66, Theydon Grove, Epping CM16 4QA
| Today | See what it's worth now |
| 22 Sep 2025 | £840,000 |
| 16 Nov 2020 | £690,000 |
No other historical records.
Copper Beeches, Hartland Road, Epping CM16 4PH
| Today | See what it's worth now |
| 15 Sep 2025 | £1,950,000 |
No other historical records.
5, Bridge Hill, Epping CM16 4ER
| Today | See what it's worth now |
| 8 Sep 2025 | £490,000 |
No other historical records.
37, Station Road, Epping CM16 4HJ
| Today | See what it's worth now |
| 8 Aug 2025 | £570,000 |
No other historical records.
Flat 5, 115, High Street, Epping CM16 4BD
| Today | See what it's worth now |
| 8 Aug 2025 | £339,000 |
No other historical records.
Source Acknowledgement: © Crown copyright. England and Wales house price data is publicly available information produced by the HM Land Registry.This material was last updated on 9 July 2026. It covers the period from 1 January 1995 to 30 April 2026 and contains property transactions which have been registered during that period. Contains HM Land Registry data © Crown copyright and database right 2026. This data is licensed under the Open Government Licence v3.0.
Disclaimer: Rightmove.co.uk provides this HM Land Registry data "as is". The burden for fitness of the data relies completely with the user and is provided for informational purposes only. No warranty, express or implied, is given relating to the accuracy of content of the HM Land Registry data and Rightmove does not accept any liability for error or omission. If you have found an error with the data or need further information please contact HM Land Registry.
Permitted Use: Viewers of this Information are granted permission to access this Crown copyright material and to download it onto electronic, magnetic, optical or similar storage media provided that such activities are for private research, study or in-house use only. Any other use of the material requires the formal written permission of Land Registry which can be requested from us, and is subject to an additional licence and associated charge.
Rightmove takes no liability for your use of, or reliance on, Rightmove's Instant Valuation due to the limitations of our tracking tool listed here. Use of this tool is taken entirely at your own risk. All rights reserved.