
House Prices in Timperley
House prices in Timperley have an overall average of £453,782 over the last year.
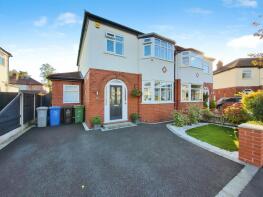
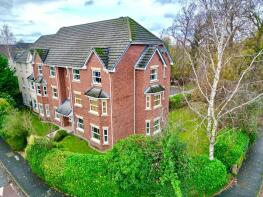
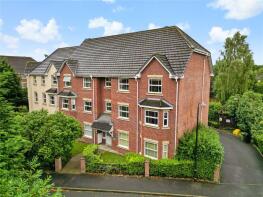
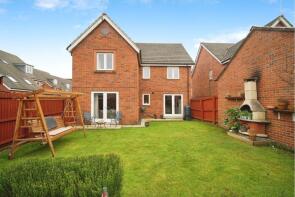
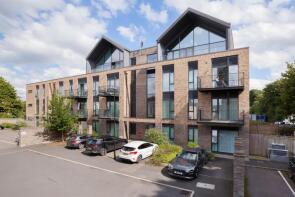
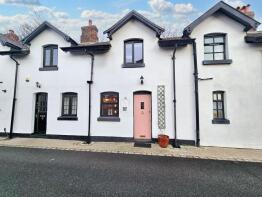
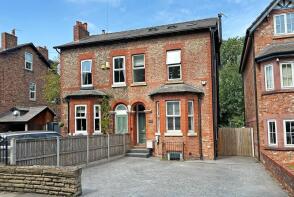
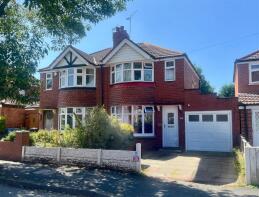
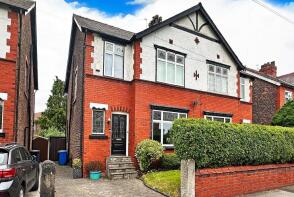
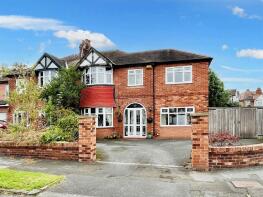
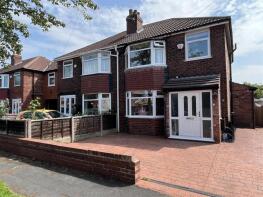
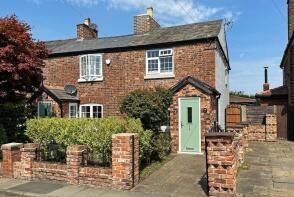
The majority of properties sold in Timperley during the last year were semi-detached properties, selling for an average price of £487,611. Terraced properties sold for an average of £367,675, with flats fetching £212,622.
Overall, the historical sold prices in Timperley over the last year were 8% up on the previous year and 4% up on the 2022 peak of £438,346.
Properties Sold
7, Vaudrey Drive, Altrincham WA15 6HH

| Today | See what it's worth now |
| 21 Apr 2026 | £507,000 |
| 10 Aug 2018 | £380,000 |
No other historical records.
Apartment 6, 1, Braystones Close, Altrincham WA15 7RB

| Today | See what it's worth now |
| 17 Apr 2026 | £175,000 |
| 9 Jun 2017 | £155,000 |
No other historical records.
Flat 3, 37, Turnbull Road, Altrincham WA14 5UP

| Today | See what it's worth now |
| 16 Apr 2026 | £260,000 |
| 27 Mar 2020 | £196,000 |
14, South Vale Crescent, Altrincham WA15 7RY
| Today | See what it's worth now |
| 8 Apr 2026 | £540,000 |
| 6 Dec 2013 | £205,500 |
No other historical records.
Apartment 7, 10 Newhaven, Tulip Drive, Altrincham WA15 6LP
| Today | See what it's worth now |
| 31 Mar 2026 | £176,250 |
| 5 Oct 2017 | £142,500 |
Apartment 2, 184, Kentmere Road, Altrincham WA15 7NT
| Today | See what it's worth now |
| 30 Mar 2026 | £198,000 |
| 29 Sep 2005 | £160,000 |
No other historical records.
Apartment 5, 7, Maryport Drive, Altrincham WA15 7NS
| Today | See what it's worth now |
| 27 Mar 2026 | £188,500 |
| 29 Nov 2013 | £125,000 |
26, Downham Chase, Altrincham WA15 7TJ

| Today | See what it's worth now |
| 20 Mar 2026 | £535,000 |
| 7 Jul 1999 | £129,950 |
No other historical records.
26, Badger Road, Altrincham WA14 5UZ
| Today | See what it's worth now |
| 17 Mar 2026 | £735,000 |
| 9 Dec 2005 | £337,000 |
No other historical records.
Apartment 18, 11 Stonebrook, Etchells Road, Altrincham WA14 5AA
| Today | See what it's worth now |
| 13 Mar 2026 | £184,800 |
| 30 Sep 2021 | £169,000 |
2, Station Cottages, Manchester Road, Altrincham WA14 5PB
| Today | See what it's worth now |
| 6 Mar 2026 | £351,251 |
| 22 Oct 2020 | £260,500 |
433, Stockport Road, Altrincham WA15 7XR
| Today | See what it's worth now |
| 6 Mar 2026 | £650,000 |
| 11 Jun 2021 | £590,000 |
44, Crofton Avenue, Altrincham WA15 6DA
| Today | See what it's worth now |
| 6 Mar 2026 | £365,000 |
| 19 Oct 2022 | £380,000 |
No other historical records.
8, Woodcote Road, Altrincham WA14 5PY
| Today | See what it's worth now |
| 5 Mar 2026 | £525,000 |
| 30 Nov 2012 | £315,000 |
9, Huntspill Road, Altrincham WA14 5XR
| Today | See what it's worth now |
| 2 Mar 2026 | £240,000 |
No other historical records.
7, St Georges Avenue, Altrincham WA15 6HF
| Today | See what it's worth now |
| 27 Feb 2026 | £585,000 |
| 22 Jun 2007 | £343,500 |
Apartment 30, 35 Wellington Court, Wellington Road, Altrincham WA15 7RD

| Today | See what it's worth now |
| 27 Feb 2026 | £268,000 |
| 7 Oct 2005 | £229,000 |
No other historical records.
10, Vaudrey Drive, Altrincham WA15 6HQ
| Today | See what it's worth now |
| 27 Feb 2026 | £433,000 |
| 19 Dec 2017 | £321,500 |
89, Grove Lane, Altrincham WA15 6PN
| Today | See what it's worth now |
| 27 Feb 2026 | £270,000 |
| 19 May 2022 | £266,000 |
No other historical records.
28, Keswick Road, Altrincham WA15 7DU

| Today | See what it's worth now |
| 27 Feb 2026 | £177,500 |
| 18 Jan 2024 | £155,000 |
No other historical records.
32, Garner Avenue, Altrincham WA15 6AG
| Today | See what it's worth now |
| 26 Feb 2026 | £354,000 |
| 13 Jun 2003 | £138,000 |
No other historical records.
15, Over Ashberry, Altrincham WA14 5ZN
| Today | See what it's worth now |
| 26 Feb 2026 | £665,000 |
| 15 Jun 2012 | £325,995 |
No other historical records.
32, Downs Drive, Altrincham WA14 5QT

| Today | See what it's worth now |
| 23 Feb 2026 | £390,000 |
| 14 Nov 2003 | £155,000 |
Source Acknowledgement: © Crown copyright. England and Wales house price data is publicly available information produced by the HM Land Registry.This material was last updated on 9 July 2026. It covers the period from 1 January 1995 to 30 April 2026 and contains property transactions which have been registered during that period. Contains HM Land Registry data © Crown copyright and database right 2026. This data is licensed under the Open Government Licence v3.0.
Disclaimer: Rightmove.co.uk provides this HM Land Registry data "as is". The burden for fitness of the data relies completely with the user and is provided for informational purposes only. No warranty, express or implied, is given relating to the accuracy of content of the HM Land Registry data and Rightmove does not accept any liability for error or omission. If you have found an error with the data or need further information please contact HM Land Registry.
Permitted Use: Viewers of this Information are granted permission to access this Crown copyright material and to download it onto electronic, magnetic, optical or similar storage media provided that such activities are for private research, study or in-house use only. Any other use of the material requires the formal written permission of Land Registry which can be requested from us, and is subject to an additional licence and associated charge.
Rightmove takes no liability for your use of, or reliance on, Rightmove's Instant Valuation due to the limitations of our tracking tool listed here. Use of this tool is taken entirely at your own risk. All rights reserved.