
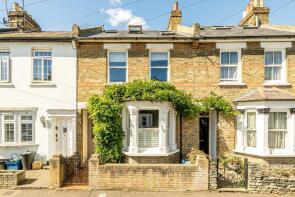
House Prices in TW1
House prices in TW1 have an overall average of £920,814 over the last year.
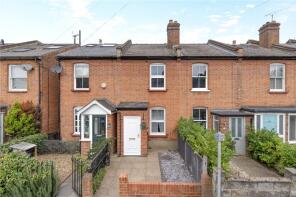
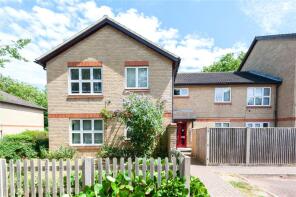
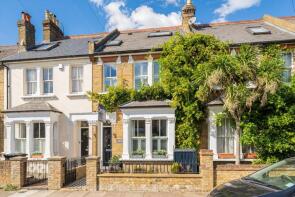
The majority of properties sold in TW1 during the last year were flats, selling for an average price of £537,448. Terraced properties sold for an average of £1,066,551, with semi-detached properties fetching £1,420,507.
Overall, the historical sold prices in TW1 over the last year were 2% up on the previous year and 2% down on the 2022 peak of £940,584.
Properties Sold
Flat 5, 11, Cambridge Park, Twickenham TW1 2PF
| Today | See what it's worth now |
| 20 Apr 2026 | £950,000 |
| 15 Nov 2020 | £750,000 |
Flat 8, 98, Amyand Park Road, Twickenham TW1 3HH
| Today | See what it's worth now |
| 17 Apr 2026 | £321,500 |
| 25 May 2007 | £235,000 |
Flat 2, Milton Lodge, Whitton Road, Twickenham TW1 1BU
| Today | See what it's worth now |
| 17 Apr 2026 | £300,000 |
| 13 Mar 2015 | £248,000 |
Extensions and planning permission in TW1
See planning approval stats, extension build costs and value added estimates.

12a, Sidney Road, Twickenham TW1 1JR
| Today | See what it's worth now |
| 10 Apr 2026 | £595,000 |
| 10 Jun 2003 | £277,000 |
21a, Claremont Road, Twickenham TW1 2QX
| Today | See what it's worth now |
| 10 Apr 2026 | £499,950 |
| 15 Sep 2014 | £316,000 |
51, Orchard Road, Twickenham TW1 1LX
| Today | See what it's worth now |
| 30 Mar 2026 | £635,000 |
| 26 May 2017 | £422,000 |
No other historical records.
23, Cumberland Close, Twickenham TW1 1RS
| Today | See what it's worth now |
| 27 Mar 2026 | £530,000 |
| 1 Feb 2005 | £240,000 |
No other historical records.
5, Langham Court, Park Road, Twickenham TW1 2PS
| Today | See what it's worth now |
| 13 Mar 2026 | £505,000 |
| 11 Nov 2019 | £450,000 |
7a, Richmond Parade, Richmond Road, Twickenham TW1 2ET
| Today | See what it's worth now |
| 13 Mar 2026 | £494,500 |
No other historical records.
17, Haliburton Road, Twickenham TW1 1PD
| Today | See what it's worth now |
| 12 Mar 2026 | £1,051,600 |
| 10 Dec 2012 | £580,000 |
23a, Grosvenor Road, Twickenham TW1 4AD
| Today | See what it's worth now |
| 3 Mar 2026 | £475,000 |
| 25 Jun 2014 | £475,000 |
Flat 1, 15, Cambridge Park, Twickenham TW1 2JE

| Today | See what it's worth now |
| 2 Mar 2026 | £1,140,000 |
| 11 Nov 2011 | £497,000 |
No other historical records.
Flat 9, 133a Phelps House, St Margarets Road, Twickenham TW1 1RG
| Today | See what it's worth now |
| 2 Mar 2026 | £517,500 |
| 17 Feb 2015 | £560,000 |
No other historical records.
26a, Queens Road, Twickenham TW1 4EX
| Today | See what it's worth now |
| 27 Feb 2026 | £530,000 |
| 4 Jul 2018 | £442,500 |
Flat 15, 31 Bevan Court, Clevedon Road, Twickenham TW1 2TS
| Today | See what it's worth now |
| 27 Feb 2026 | £1,809,124 |
| 3 Nov 2000 | £615,000 |
49, Newry Road, Twickenham TW1 1PJ

| Today | See what it's worth now |
| 27 Feb 2026 | £1,555,000 |
| 19 Jun 2018 | £840,000 |
Flat 9, 2 Evergreen House, King Street, Twickenham TW1 3RZ

| Today | See what it's worth now |
| 27 Feb 2026 | £300,000 |
| 29 Jan 2016 | £340,000 |
No other historical records.
18, Radnor Gardens, Twickenham TW1 4NA
| Today | See what it's worth now |
| 27 Feb 2026 | £637,500 |
No other historical records.
12, 33 Ashe House, Clevedon Road, Twickenham TW1 2TT
| Today | See what it's worth now |
| 27 Feb 2026 | £2,475,000 |
| 24 Sep 1998 | £555,000 |
No other historical records.
2, Ivybridge Close, Twickenham TW1 1EA
| Today | See what it's worth now |
| 27 Feb 2026 | £310,000 |
| 20 Feb 2019 | £266,000 |
No other historical records.
39, Haliburton Road, Twickenham TW1 1PD
| Today | See what it's worth now |
| 23 Feb 2026 | £1,275,000 |
| 9 Dec 2016 | £900,000 |
5, Cambridge Park Court, Cambridge Park, Twickenham TW1 2JN
| Today | See what it's worth now |
| 17 Feb 2026 | £675,000 |
| 6 Jul 2007 | £390,000 |
No other historical records.
19, Newry Road, Twickenham TW1 1PJ
| Today | See what it's worth now |
| 17 Feb 2026 | £1,050,000 |
| 31 May 2013 | £670,000 |
Source Acknowledgement: © Crown copyright. England and Wales house price data is publicly available information produced by the HM Land Registry.This material was last updated on 9 July 2026. It covers the period from 1 January 1995 to 30 April 2026 and contains property transactions which have been registered during that period. Contains HM Land Registry data © Crown copyright and database right 2026. This data is licensed under the Open Government Licence v3.0.
Disclaimer: Rightmove.co.uk provides this HM Land Registry data "as is". The burden for fitness of the data relies completely with the user and is provided for informational purposes only. No warranty, express or implied, is given relating to the accuracy of content of the HM Land Registry data and Rightmove does not accept any liability for error or omission. If you have found an error with the data or need further information please contact HM Land Registry.
Permitted Use: Viewers of this Information are granted permission to access this Crown copyright material and to download it onto electronic, magnetic, optical or similar storage media provided that such activities are for private research, study or in-house use only. Any other use of the material requires the formal written permission of Land Registry which can be requested from us, and is subject to an additional licence and associated charge.
Rightmove takes no liability for your use of, or reliance on, Rightmove's Instant Valuation due to the limitations of our tracking tool listed here. Use of this tool is taken entirely at your own risk. All rights reserved.