
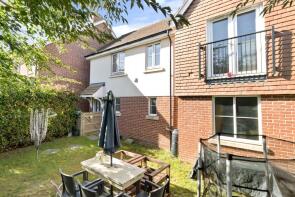
House Prices in Upper Horsebridge
House prices in Upper Horsebridge have an overall average of £337,290 over the last year.
The majority of properties sold in Upper Horsebridge during the last year were semi-detached properties, selling for an average price of £312,423. Detached properties sold for an average of £425,614, with terraced properties fetching £278,254.
Overall, the historical sold prices in Upper Horsebridge over the last year were 2% up on the previous year and 8% down on the 2022 peak of £365,523.
Properties Sold
193, London Road, Hailsham BN27 3AP

| Today | See what it's worth now |
| 27 Apr 2026 | £270,000 |
| 25 Jul 2014 | £201,000 |
48, Quinnell Drive, Hailsham BN27 1QN
| Today | See what it's worth now |
| 10 Apr 2026 | £270,000 |
| 18 Jan 2002 | £87,000 |
1, Wentworth Close, Hailsham BN27 3UR
| Today | See what it's worth now |
| 10 Apr 2026 | £390,000 |
| 18 Aug 2005 | £248,000 |
No other historical records.
18, Harebeating Crescent, Hailsham BN27 1JH
| Today | See what it's worth now |
| 30 Mar 2026 | £335,000 |
| 23 Nov 2018 | £247,500 |
15, Cromer Way, Hailsham BN27 3DW
| Today | See what it's worth now |
| 27 Mar 2026 | £295,000 |
| 27 Mar 2026 | £295,000 |
11, Arran Close, Hailsham BN27 3DZ
| Today | See what it's worth now |
| 12 Mar 2026 | £385,000 |
| 7 Feb 2014 | £233,000 |
39, Quinnell Drive, Hailsham BN27 1QN
| Today | See what it's worth now |
| 12 Mar 2026 | £417,500 |
| 30 Jun 2021 | £365,000 |
29, Quinnell Drive, Hailsham BN27 1QN
| Today | See what it's worth now |
| 11 Mar 2026 | £245,000 |
| 15 Jul 2022 | £250,000 |
7, Barlow Place, Hailsham BN27 3GX
| Today | See what it's worth now |
| 10 Mar 2026 | £355,000 |
| 20 Jul 2018 | £270,000 |
203, London Road, Hailsham BN27 3AP
| Today | See what it's worth now |
| 9 Mar 2026 | £385,000 |
| 29 Jul 2016 | £292,000 |
No other historical records.
5, Harebeating Gardens, Hailsham BN27 1JT
| Today | See what it's worth now |
| 9 Mar 2026 | £295,000 |
No other historical records.
6, Conquest Drive, Hailsham BN27 1EF
| Today | See what it's worth now |
| 6 Mar 2026 | £275,000 |
No other historical records.
7, Robin Way, Hailsham BN27 1FU
| Today | See what it's worth now |
| 4 Mar 2026 | £477,500 |
| 18 Dec 2017 | £399,995 |
No other historical records.
46, Howlett Drive, Hailsham BN27 1QW
| Today | See what it's worth now |
| 26 Feb 2026 | £239,000 |
| 19 Jul 2018 | £205,000 |
32, Quinnell Drive, Hailsham BN27 1QN
| Today | See what it's worth now |
| 24 Feb 2026 | £184,000 |
| 11 Apr 2012 | £145,000 |
No other historical records.
3, Bell Bank Cottages, Hawkswood Road, Hailsham BN27 1UY
| Today | See what it's worth now |
| 20 Feb 2026 | £360,000 |
| 30 Oct 1998 | £122,500 |
No other historical records.
23, Solway, Hailsham BN27 3HB
| Today | See what it's worth now |
| 6 Feb 2026 | £220,000 |
| 16 Dec 1999 | £84,950 |
No other historical records.
10, Amberstone View, Hailsham BN27 1JU
| Today | See what it's worth now |
| 30 Jan 2026 | £384,000 |
| 20 Jul 2023 | £400,000 |
3, Cuckmere Close, Hailsham BN27 3FT
| Today | See what it's worth now |
| 30 Jan 2026 | £345,000 |
| 28 Mar 2025 | £342,000 |
6, Lansdowne Drive, Hailsham BN27 1LG
| Today | See what it's worth now |
| 23 Jan 2026 | £283,000 |
| 28 Mar 2025 | £190,000 |
No other historical records.
106, London Road, Hailsham BN27 3AL

| Today | See what it's worth now |
| 16 Jan 2026 | £348,500 |
| 2 Sep 2004 | £212,000 |
No other historical records.
49, Gournay Road, Hailsham BN27 3GE
| Today | See what it's worth now |
| 13 Jan 2026 | £285,000 |
| 14 Sep 2012 | £195,000 |
No other historical records.
4, Douglass Walk, Hailsham BN27 3GR
| Today | See what it's worth now |
| 9 Jan 2026 | £223,000 |
| 14 Jun 2023 | £234,500 |
Source Acknowledgement: © Crown copyright. England and Wales house price data is publicly available information produced by the HM Land Registry.This material was last updated on 9 July 2026. It covers the period from 1 January 1995 to 30 April 2026 and contains property transactions which have been registered during that period. Contains HM Land Registry data © Crown copyright and database right 2026. This data is licensed under the Open Government Licence v3.0.
Disclaimer: Rightmove.co.uk provides this HM Land Registry data "as is". The burden for fitness of the data relies completely with the user and is provided for informational purposes only. No warranty, express or implied, is given relating to the accuracy of content of the HM Land Registry data and Rightmove does not accept any liability for error or omission. If you have found an error with the data or need further information please contact HM Land Registry.
Permitted Use: Viewers of this Information are granted permission to access this Crown copyright material and to download it onto electronic, magnetic, optical or similar storage media provided that such activities are for private research, study or in-house use only. Any other use of the material requires the formal written permission of Land Registry which can be requested from us, and is subject to an additional licence and associated charge.
Rightmove takes no liability for your use of, or reliance on, Rightmove's Instant Valuation due to the limitations of our tracking tool listed here. Use of this tool is taken entirely at your own risk. All rights reserved.