
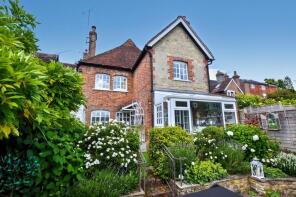
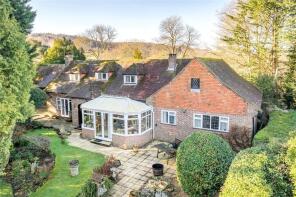
House Prices in Upper Norwood
House prices in Upper Norwood have an overall average of £584,210 over the last year.
The majority of properties sold in Upper Norwood during the last year were detached properties, selling for an average price of £774,273. Terraced properties sold for an average of £512,143, with semi-detached properties fetching £412,400.
Overall, the historical sold prices in Upper Norwood over the last year were 4% down on the previous year and 21% down on the 2023 peak of £741,322.
Properties Sold
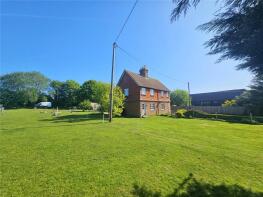
7 Dove Cottage, North Street, Petworth GU28 0DJ
| Today | See what it's worth now |
| 20 Feb 2026 | £280,000 |
| 9 Nov 2017 | £300,000 |
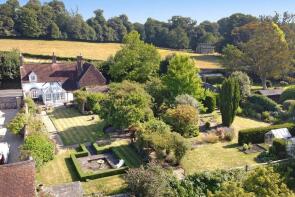
Windmill House, High Street, Petworth GU28 0AU
| Today | See what it's worth now |
| 17 Feb 2026 | £990,000 |
| 1 Sep 2006 | £650,000 |
3, Morgan Court, Station Road, Petworth GU28 0FE
| Today | See what it's worth now |
| 19 Jan 2026 | £181,250 |
| 4 Sep 2020 | £159,950 |
4, Montier Terrace, Angel Street, Petworth GU28 0BQ
| Today | See what it's worth now |
| 9 Jan 2026 | £360,000 |
| 8 Feb 2019 | £290,000 |
47, Sheepdown Drive, Petworth GU28 0BX

| Today | See what it's worth now |
| 18 Dec 2025 | £350,000 |
| 26 Sep 2022 | £510,000 |
15, Willow Walk, Petworth GU28 0EY
| Today | See what it's worth now |
| 17 Dec 2025 | £270,000 |
| 16 Jun 2006 | £175,000 |
Summer Cottage, The Street, Petworth GU28 0QB
| Today | See what it's worth now |
| 8 Dec 2025 | £830,000 |
| 12 Apr 2019 | £585,000 |
1, Old School Close, Petworth GU28 9BF
| Today | See what it's worth now |
| 1 Dec 2025 | £410,000 |
| 30 Sep 2021 | £397,500 |
No other historical records.
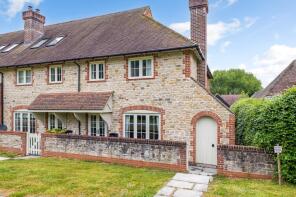
1, Boderton Mews, Burton Park Road, Petworth GU28 0LS

| Today | See what it's worth now |
| 13 Nov 2025 | £785,000 |
| 17 Dec 2013 | £525,000 |
2, Morgan Court, Station Road, Petworth GU28 0FE
| Today | See what it's worth now |
| 7 Nov 2025 | £260,000 |
| 28 Feb 2014 | £309,950 |
No other historical records.
The Drifters, A285 Willett Close To Duncton Church Road, Petworth GU28 0JZ
| Today | See what it's worth now |
| 31 Oct 2025 | £795,000 |
| 19 Mar 2021 | £765,000 |
2, Newbarn Cottages, A272 Halfway Bridge To Brookfield Lane, Petworth GU28 0PG
| Today | See what it's worth now |
| 22 Oct 2025 | £485,000 |
| 16 Jun 2020 | £445,000 |
Tudor Cottage, Tillington Road, Petworth GU28 0RA
| Today | See what it's worth now |
| 20 Oct 2025 | £845,000 |
| 12 Oct 2000 | £350,000 |
3, The Drive, Petworth GU28 0FG
| Today | See what it's worth now |
| 3 Oct 2025 | £610,000 |
| 27 Apr 2022 | £670,000 |
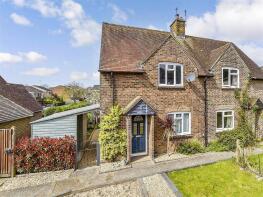
18, Station Road, Petworth GU28 0EX
| Today | See what it's worth now |
| 1 Oct 2025 | £350,000 |
| 24 Jul 2017 | £275,000 |
310 Rose Cottage, North Street, Petworth GU28 0DF
| Today | See what it's worth now |
| 25 Sep 2025 | £467,000 |
| 31 Mar 2008 | £262,500 |
8, Boderton Mews, Burton Park Road, Petworth GU28 0LS
| Today | See what it's worth now |
| 12 Sep 2025 | £555,000 |
| 11 Oct 2012 | £485,000 |
Duncton Cottage, High Street, Duncton GU28 0LT

| Today | See what it's worth now |
| 11 Sep 2025 | £780,000 |
No other historical records.
Boles House, East Street, Petworth GU28 0AB
| Today | See what it's worth now |
| 3 Sep 2025 | £1,400,000 |
No other historical records.
Little Orchards, High Street, Duncton GU28 0LB
| Today | See what it's worth now |
| 8 Aug 2025 | £412,000 |
No other historical records.
3, Garden Mews, Petworth GU28 0QS
| Today | See what it's worth now |
| 5 Aug 2025 | £620,000 |
| 5 Aug 2025 | £620,000 |
Shieling Cottage, North Street, Petworth GU28 0DQ
| Today | See what it's worth now |
| 28 Jul 2025 | £375,000 |
| 17 Nov 2006 | £232,500 |
No other historical records.
Monks, Lombard Street, Petworth GU28 0AG
| Today | See what it's worth now |
| 30 Jun 2025 | £725,000 |
No other historical records.
Little Mistletoe Cottage, Graffham Street, Petworth GU28 0NS
| Today | See what it's worth now |
| 6 Jun 2025 | £850,000 |
| 7 Jan 2004 | £580,000 |
No other historical records.
22, Toronto Road, Petworth GU28 0QX
| Today | See what it's worth now |
| 31 Mar 2025 | £430,000 |
| 23 Nov 2007 | £299,950 |
No other historical records.
Source Acknowledgement: © Crown copyright. England and Wales house price data is publicly available information produced by the HM Land Registry.This material was last updated on 15 May 2026. It covers the period from 1 January 1995 to 31 March 2026 and contains property transactions which have been registered during that period. Contains HM Land Registry data © Crown copyright and database right 2026. This data is licensed under the Open Government Licence v3.0.
Disclaimer: Rightmove.co.uk provides this HM Land Registry data "as is". The burden for fitness of the data relies completely with the user and is provided for informational purposes only. No warranty, express or implied, is given relating to the accuracy of content of the HM Land Registry data and Rightmove does not accept any liability for error or omission. If you have found an error with the data or need further information please contact HM Land Registry.
Permitted Use: Viewers of this Information are granted permission to access this Crown copyright material and to download it onto electronic, magnetic, optical or similar storage media provided that such activities are for private research, study or in-house use only. Any other use of the material requires the formal written permission of Land Registry which can be requested from us, and is subject to an additional licence and associated charge.
Map data ©OpenStreetMap contributors.
Rightmove takes no liability for your use of, or reliance on, Rightmove's Instant Valuation due to the limitations of our tracking tool listed here. Use of this tool is taken entirely at your own risk. All rights reserved.