
House Prices in Warnham
House prices in Warnham have an overall average of £681,128 over the last year.
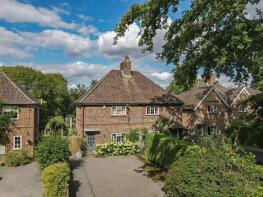
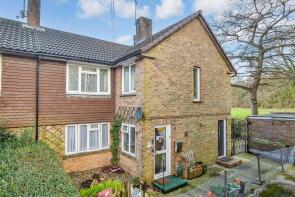
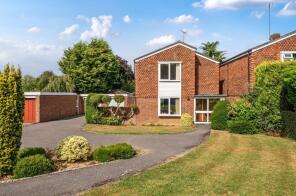
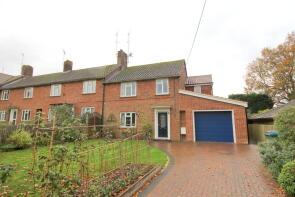
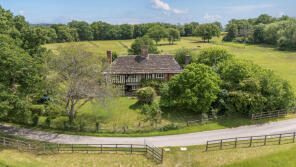
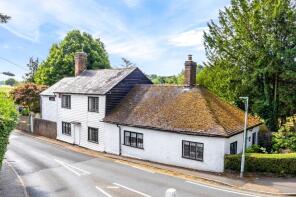
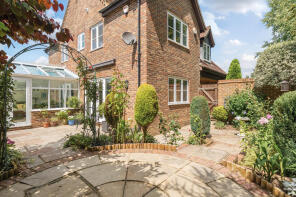
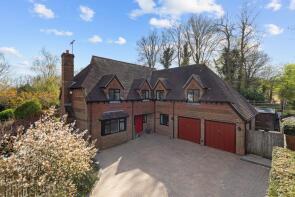
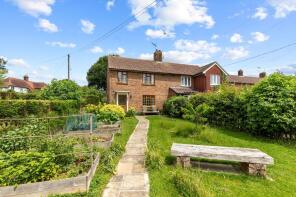
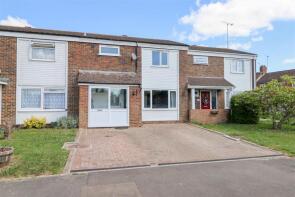
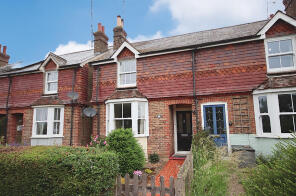
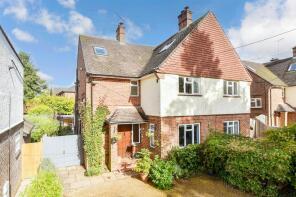
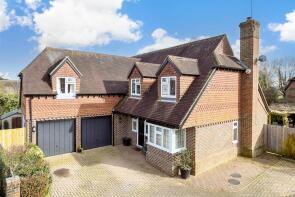
The majority of properties sold in Warnham during the last year were detached properties, selling for an average price of £879,721. Semi-detached properties sold for an average of £525,000, with terraced properties fetching £672,500.
Overall, the historical sold prices in Warnham over the last year were 2% down on the previous year and 13% up on the 2023 peak of £604,306.
Properties Sold
35, Bell Road, Horsham RH12 3QJ
| Today | See what it's worth now |
| 31 Mar 2026 | £575,000 |
| 26 Nov 2021 | £440,000 |
No other historical records.
25, Tilletts Lane, Warnham RH12 3RE
| Today | See what it's worth now |
| 4 Mar 2026 | £245,000 |
No other historical records.
1, Farm Close, Horsham RH12 3QT
| Today | See what it's worth now |
| 5 Feb 2026 | £600,000 |
| 21 Jun 2000 | £215,000 |
No other historical records.
12, Tilletts Lane, Horsham RH12 3RD
| Today | See what it's worth now |
| 30 Jan 2026 | £500,000 |
| 20 Jul 2011 | £285,000 |
Sands, Northlands Road, Warnham RH12 3SQ
| Today | See what it's worth now |
| 28 Jan 2026 | £935,000 |
No other historical records.
2, Bell Road, Horsham RH12 3QL
| Today | See what it's worth now |
| 7 Jan 2026 | £925,000 |
| 11 Mar 2021 | £725,000 |
The Granary, Broomlands Farm, Broadbridge Heath Road, Warnham RH12 3PA

| Today | See what it's worth now |
| 21 Nov 2025 | £975,000 |
No other historical records.
18, Wyvern Place, Horsham RH12 3QU
| Today | See what it's worth now |
| 16 Oct 2025 | £725,000 |
| 16 Oct 2025 | £723,050 |
Fallow House, Farm Close, Horsham RH12 3QT
| Today | See what it's worth now |
| 1 Oct 2025 | £1,150,000 |
| 15 Nov 1999 | £415,000 |
No other historical records.
76, Friday Street, Horsham RH12 3QX
| Today | See what it's worth now |
| 12 Sep 2025 | £500,000 |
| 21 Oct 2016 | £386,500 |
No other historical records.
2, Geerings Cottages, Dorking Road, Horsham RH12 3RY

| Today | See what it's worth now |
| 11 Sep 2025 | £455,000 |
| 20 Jul 2022 | £320,000 |
No other historical records.
4, Gardeners Close, Horsham RH12 3RJ
| Today | See what it's worth now |
| 15 Aug 2025 | £370,000 |
| 16 Aug 2013 | £230,000 |
8, Station Road, Horsham RH12 3SR
| Today | See what it's worth now |
| 11 Aug 2025 | £475,000 |
| 26 Jun 2017 | £410,000 |
24a, Friday Street, Horsham RH12 3QX
| Today | See what it's worth now |
| 16 Jul 2025 | £645,000 |
| 7 Mar 2008 | £339,000 |
Little Mead, Farm Close, Horsham RH12 3QT
| Today | See what it's worth now |
| 16 Jul 2025 | £1,100,000 |
| 19 Mar 2004 | £535,000 |
Tanners, Hollands Way, Horsham RH12 3RH
| Today | See what it's worth now |
| 26 Jun 2025 | £1,325,000 |
| 8 Jun 2011 | £580,000 |
No other historical records.
1 Warnham Manor, Ends Place, Byfleets Lane, Warnham RH12 3RN
| Today | See what it's worth now |
| 18 Jun 2025 | £444,000 |
| 18 Sep 2017 | £420,000 |
1, The Forge, Byfleets Lane, Horsham RH12 3UA
| Today | See what it's worth now |
| 9 May 2025 | £875,000 |
| 9 May 2002 | £440,000 |
No other historical records.
The Barn, Broomlands Farm, Broadbridge Heath Road, Warnham RH12 3PA
| Today | See what it's worth now |
| 17 Apr 2025 | £1,250,000 |
No other historical records.
The Old Dairy, Broomlands Farm, Broadbridge Heath Road, Warnham RH12 3PA
| Today | See what it's worth now |
| 31 Mar 2025 | £840,000 |
No other historical records.
66, Friday Street, Horsham RH12 3QX

| Today | See what it's worth now |
| 28 Mar 2025 | £425,000 |
| 15 Dec 2017 | £375,000 |
4, Tilletts Lane, Warnham RH12 3RD
| Today | See what it's worth now |
| 28 Mar 2025 | £483,000 |
No other historical records.
The Stables, Broomlands Farm, Broadbridge Heath Road, Warnham RH12 3PA
| Today | See what it's worth now |
| 27 Mar 2025 | £825,000 |
No other historical records.
Source Acknowledgement: © Crown copyright. England and Wales house price data is publicly available information produced by the HM Land Registry.This material was last updated on 9 July 2026. It covers the period from 1 January 1995 to 30 April 2026 and contains property transactions which have been registered during that period. Contains HM Land Registry data © Crown copyright and database right 2026. This data is licensed under the Open Government Licence v3.0.
Disclaimer: Rightmove.co.uk provides this HM Land Registry data "as is". The burden for fitness of the data relies completely with the user and is provided for informational purposes only. No warranty, express or implied, is given relating to the accuracy of content of the HM Land Registry data and Rightmove does not accept any liability for error or omission. If you have found an error with the data or need further information please contact HM Land Registry.
Permitted Use: Viewers of this Information are granted permission to access this Crown copyright material and to download it onto electronic, magnetic, optical or similar storage media provided that such activities are for private research, study or in-house use only. Any other use of the material requires the formal written permission of Land Registry which can be requested from us, and is subject to an additional licence and associated charge.
Rightmove takes no liability for your use of, or reliance on, Rightmove's Instant Valuation due to the limitations of our tracking tool listed here. Use of this tool is taken entirely at your own risk. All rights reserved.