
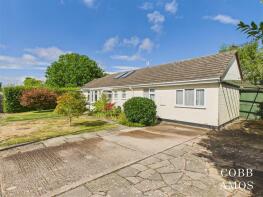
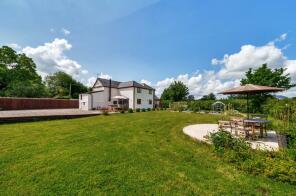
House Prices in Weobley
House prices in Weobley have an overall average of £372,774 over the last year.
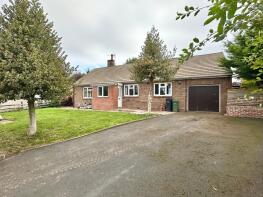
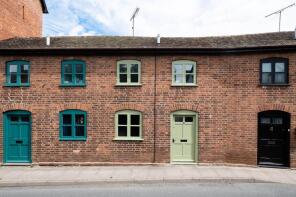
The majority of properties sold in Weobley during the last year were detached properties, selling for an average price of £490,761. Semi-detached properties sold for an average of £274,625, with terraced properties fetching £228,333.
Overall, the historical sold prices in Weobley over the last year were 3% down on the previous year and 4% down on the 2023 peak of £389,750.
Properties Sold
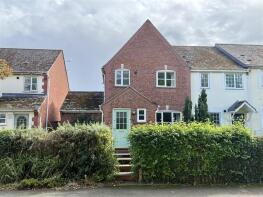
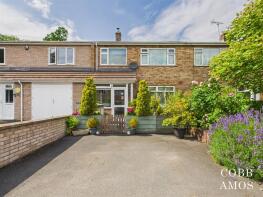
Dell Cottage, Church Road, Weobley HR4 8SD

| Today | See what it's worth now |
| 23 Mar 2026 | £425,000 |
No other historical records.
27, Bearcroft, Hereford HR4 8TA
| Today | See what it's worth now |
| 27 Feb 2026 | £355,000 |
| 1 Jul 2013 | £249,950 |
York House, Weobley Marsh, Hereford HR4 8RR
| Today | See what it's worth now |
| 26 Feb 2026 | £607,500 |
| 22 Feb 2013 | £210,000 |
Kingsmeade, Meadow Street, Hereford HR4 8QS
| Today | See what it's worth now |
| 23 Jan 2026 | £325,000 |
| 30 Apr 2020 | £225,000 |
2, Mill Bank Cottages, Mill Bank, Hereford HR4 8SH
| Today | See what it's worth now |
| 20 Jan 2026 | £200,000 |
| 14 Mar 2002 | £67,750 |
7, Apple Meadow, Hereford HR4 8RZ
| Today | See what it's worth now |
| 10 Dec 2025 | £235,000 |
| 15 Jul 2003 | £135,000 |
36, Garnstone Drive, Hereford HR4 8TH
| Today | See what it's worth now |
| 9 Dec 2025 | £312,500 |
| 29 Mar 2019 | £265,000 |
No other historical records.
1, The Corn Mills, Hereford HR4 8SS
| Today | See what it's worth now |
| 5 Dec 2025 | £256,000 |
| 21 Jul 2014 | £190,000 |
17, Bearcroft, Hereford HR4 8TA

| Today | See what it's worth now |
| 21 Nov 2025 | £315,000 |
| 25 Oct 2007 | £232,000 |
White House, Ledgemoor Road, Hereford HR4 8RJ
| Today | See what it's worth now |
| 13 Nov 2025 | £670,830 |
| 20 Oct 1995 | £149,500 |
No other historical records.
1, Chapel Orchard, Hereford HR4 8SP
| Today | See what it's worth now |
| 24 Oct 2025 | £250,000 |
| 15 Jan 2019 | £173,000 |
16, Garnstone Drive, Hereford HR4 8TH

| Today | See what it's worth now |
| 21 Oct 2025 | £255,000 |
| 2 Jun 2020 | £250,000 |
No other historical records.
25, Burton Wood, Hereford HR4 8SU
| Today | See what it's worth now |
| 30 Jul 2025 | £275,000 |
| 2 Dec 2009 | £140,000 |
No other historical records.
1, Orchard View, Hereford HR4 8FL
| Today | See what it's worth now |
| 8 Jul 2025 | £737,000 |
| 7 Aug 2020 | £650,000 |
No other historical records.
Fenmore, Meadow Street, Hereford HR4 8SF

| Today | See what it's worth now |
| 28 Mar 2025 | £770,000 |
| 17 Nov 2011 | £571,624 |
80, Bearcroft, Weobley HR4 8TD
| Today | See what it's worth now |
| 27 Mar 2025 | £272,500 |
No other historical records.
12, Apple Meadow, Hereford HR4 8RZ
| Today | See what it's worth now |
| 26 Mar 2025 | £340,000 |
| 28 Feb 1997 | £89,995 |
No other historical records.
Rose Cottage, Church Road, Hereford HR4 8SD

| Today | See what it's worth now |
| 3 Mar 2025 | £400,000 |
| 7 Sep 2018 | £293,500 |
9, Portland Close, Hereford HR4 8SQ
| Today | See what it's worth now |
| 18 Feb 2025 | £295,000 |
| 15 Oct 2003 | £198,500 |
71, Bearcroft, Hereford HR4 8TD

| Today | See what it's worth now |
| 28 Jan 2025 | £310,000 |
| 9 Jan 2015 | £245,000 |
20, Bearcroft, Hereford HR4 8TA

| Today | See what it's worth now |
| 19 Dec 2024 | £335,000 |
| 18 Apr 2019 | £240,000 |
Bunderberg, The Marsh, Weobley HR4 8RR
| Today | See what it's worth now |
| 18 Dec 2024 | £400,000 |
No other historical records.
Marlbank Cottage, Back Lane, Weobley HR4 8SG

| Today | See what it's worth now |
| 16 Dec 2024 | £555,000 |
| 12 Dec 2014 | £410,000 |


Source Acknowledgement: © Crown copyright. England and Wales house price data is publicly available information produced by the HM Land Registry.This material was last updated on 9 July 2026. It covers the period from 1 January 1995 to 30 April 2026 and contains property transactions which have been registered during that period. Contains HM Land Registry data © Crown copyright and database right 2026. This data is licensed under the Open Government Licence v3.0.
Disclaimer: Rightmove.co.uk provides this HM Land Registry data "as is". The burden for fitness of the data relies completely with the user and is provided for informational purposes only. No warranty, express or implied, is given relating to the accuracy of content of the HM Land Registry data and Rightmove does not accept any liability for error or omission. If you have found an error with the data or need further information please contact HM Land Registry.
Permitted Use: Viewers of this Information are granted permission to access this Crown copyright material and to download it onto electronic, magnetic, optical or similar storage media provided that such activities are for private research, study or in-house use only. Any other use of the material requires the formal written permission of Land Registry which can be requested from us, and is subject to an additional licence and associated charge.
Rightmove takes no liability for your use of, or reliance on, Rightmove's Instant Valuation due to the limitations of our tracking tool listed here. Use of this tool is taken entirely at your own risk. All rights reserved.