
House Prices in Whitstable
House prices in Whitstable have an overall average of £434,319 over the last year.
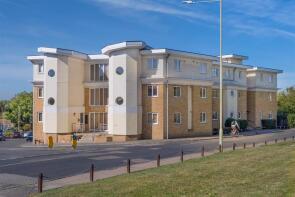
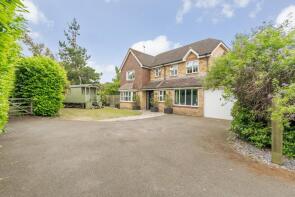
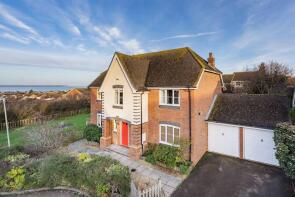
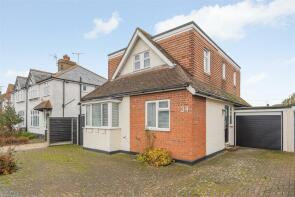
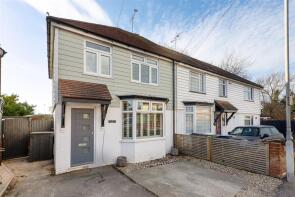
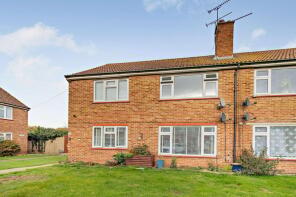
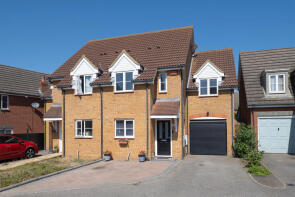
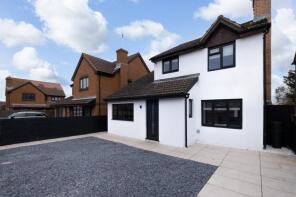
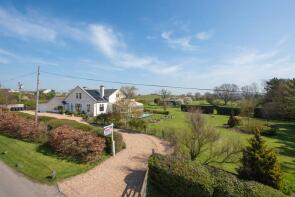
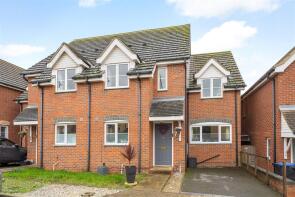
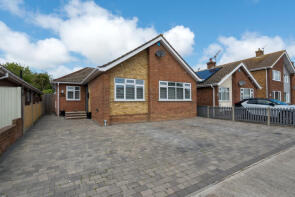
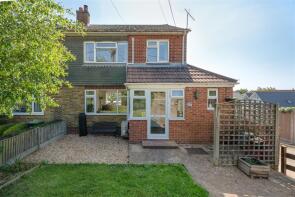
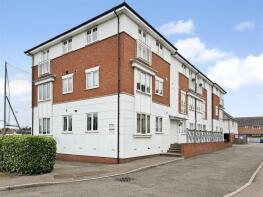
The majority of properties sold in Whitstable during the last year were detached properties, selling for an average price of £565,070. Semi-detached properties sold for an average of £388,100, with terraced properties fetching £392,263.
Overall, the historical sold prices in Whitstable over the last year were 6% down on the previous year and 9% down on the 2022 peak of £479,865.
Properties Sold
Flat 20, Carlton Court, Castle Road, Whitstable CT5 1FN
| Today | See what it's worth now |
| 24 Apr 2026 | £243,000 |
| 1 Oct 2012 | £195,000 |
No other historical records.
15, Kendal Meadow, Whitstable CT5 3PZ
| Today | See what it's worth now |
| 24 Apr 2026 | £805,000 |
| 27 Aug 2019 | £800,000 |
9, Ibis Close, Whitstable CT5 3RH
| Today | See what it's worth now |
| 17 Apr 2026 | £587,500 |
| 7 Aug 2013 | £365,000 |
34, Manor Road, Whitstable CT5 2JT
| Today | See what it's worth now |
| 17 Apr 2026 | £485,000 |
| 26 Oct 2012 | £322,500 |
3, Millstrood Road, North Of Thanet Way, Whitstable CT5 1QQ
| Today | See what it's worth now |
| 17 Apr 2026 | £340,000 |
| 1 May 2020 | £280,000 |
25, Emmerson Gardens, Whitstable CT5 2NA
| Today | See what it's worth now |
| 10 Apr 2026 | £172,000 |
| 21 Oct 2024 | £180,000 |
Rose End, St John's Road, Whitstable CT5 2QT

| Today | See what it's worth now |
| 10 Apr 2026 | £141,000 |
No other historical records.
24, Thistle Drive, Whitstable CT5 4UN
| Today | See what it's worth now |
| 10 Apr 2026 | £360,000 |
| 11 Aug 2004 | £178,995 |
No other historical records.
10, Primrose Way, Whitstable CT5 3QN
| Today | See what it's worth now |
| 9 Apr 2026 | £485,000 |
| 30 Oct 2020 | £360,000 |
59 Martell Lodge, Golden Hill, South Of Thanet Way, Whitstable CT5 3AR
| Today | See what it's worth now |
| 9 Apr 2026 | £1,160,000 |
| 12 Feb 1999 | £267,000 |
No other historical records.
8b, St John's Road, Whitstable CT5 2QU
| Today | See what it's worth now |
| 1 Apr 2026 | £225,000 |
| 13 Jun 2024 | £135,000 |
7, Emelina Way, Whitstable CT5 3RL
| Today | See what it's worth now |
| 1 Apr 2026 | £369,950 |
| 16 Jan 2019 | £320,000 |
59, Herne Bay Road, Whitstable CT5 2LL
| Today | See what it's worth now |
| 1 Apr 2026 | £625,000 |
| 25 Oct 2000 | £140,000 |
No other historical records.
39, Preston Parade, Whitstable CT5 4AJ
| Today | See what it's worth now |
| 31 Mar 2026 | £1,000,000 |
| 22 Feb 2023 | £1,150,000 |
No other historical records.
86, Station Road, Whitstable CT5 1LF
| Today | See what it's worth now |
| 27 Mar 2026 | £300,000 |
| 23 Dec 2013 | £221,000 |
No other historical records.
10, Oakwood Drive, Whitstable CT5 1NY
| Today | See what it's worth now |
| 27 Mar 2026 | £475,000 |
| 29 May 1998 | £97,650 |
No other historical records.
93, Olympia Way, Whitstable CT5 3FP
| Today | See what it's worth now |
| 27 Mar 2026 | £192,000 |
| 24 Sep 2015 | £159,000 |
No other historical records.
11, Edgar Close, Whitstable CT5 2SA
| Today | See what it's worth now |
| 27 Mar 2026 | £350,000 |
| 13 Mar 2003 | £157,500 |
No other historical records.
36, Burnan Road, Whitstable CT5 2QB
| Today | See what it's worth now |
| 26 Mar 2026 | £655,000 |
| 9 Aug 2018 | £322,500 |
No other historical records.
57, Millstrood Road, North Of Thanet Way, Whitstable CT5 1QF
| Today | See what it's worth now |
| 26 Mar 2026 | £380,000 |
| 2 Mar 2018 | £325,000 |
17, Wicketts End, Whitstable CT5 1WD
| Today | See what it's worth now |
| 26 Mar 2026 | £240,000 |
| 30 Sep 2021 | £230,000 |
68, Joy Lane, Whitstable CT5 4DB
| Today | See what it's worth now |
| 26 Mar 2026 | £795,000 |
| 28 Jul 2022 | £890,000 |
No other historical records.
100, Clare Road, Whitstable CT5 2EH

| Today | See what it's worth now |
| 26 Mar 2026 | £583,000 |
| 19 Jul 2019 | £412,500 |
No other historical records.
Source Acknowledgement: © Crown copyright. England and Wales house price data is publicly available information produced by the HM Land Registry.This material was last updated on 9 July 2026. It covers the period from 1 January 1995 to 30 April 2026 and contains property transactions which have been registered during that period. Contains HM Land Registry data © Crown copyright and database right 2026. This data is licensed under the Open Government Licence v3.0.
Disclaimer: Rightmove.co.uk provides this HM Land Registry data "as is". The burden for fitness of the data relies completely with the user and is provided for informational purposes only. No warranty, express or implied, is given relating to the accuracy of content of the HM Land Registry data and Rightmove does not accept any liability for error or omission. If you have found an error with the data or need further information please contact HM Land Registry.
Permitted Use: Viewers of this Information are granted permission to access this Crown copyright material and to download it onto electronic, magnetic, optical or similar storage media provided that such activities are for private research, study or in-house use only. Any other use of the material requires the formal written permission of Land Registry which can be requested from us, and is subject to an additional licence and associated charge.
Rightmove takes no liability for your use of, or reliance on, Rightmove's Instant Valuation due to the limitations of our tracking tool listed here. Use of this tool is taken entirely at your own risk. All rights reserved.