
House Prices in Wimborne
House prices in Wimborne have an overall average of £454,035 over the last year.
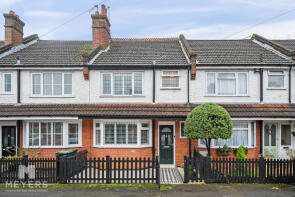
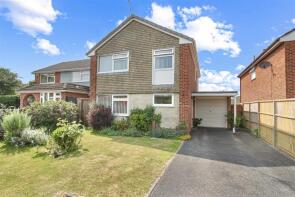
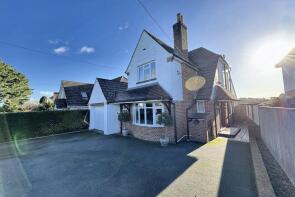
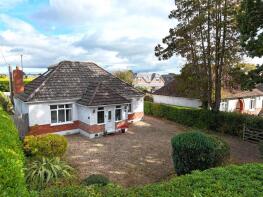
The majority of properties sold in Wimborne during the last year were detached properties, selling for an average price of £573,307. Semi-detached properties sold for an average of £394,305, with terraced properties fetching £345,755.
Overall, the historical sold prices in Wimborne over the last year were similar to the previous year and 7% down on the 2022 peak of £490,600.
Properties Sold
35, Pilford Heath Road, Wimborne BH21 2LU
| Today | See what it's worth now |
| 24 Apr 2026 | £737,500 |
| 19 Jun 2006 | £470,000 |
20, Candys Close, Wimborne BH21 3EL
| Today | See what it's worth now |
| 24 Apr 2026 | £345,000 |
| 26 Jun 2000 | £125,000 |
No other historical records.
29, Forest View Drive, Wimborne BH21 7NU
| Today | See what it's worth now |
| 16 Apr 2026 | £350,000 |
| 19 Dec 2016 | £295,000 |
1, Freemans Close, Wimborne BH21 2JW
| Today | See what it's worth now |
| 8 Apr 2026 | £365,000 |
| 12 Oct 2017 | £342,500 |
No other historical records.
57, Wimborne Road, Wimborne BH21 2RR
| Today | See what it's worth now |
| 1 Apr 2026 | £630,000 |
| 4 Nov 2016 | £457,500 |
8, Dogdean, Wimborne BH21 4HA
| Today | See what it's worth now |
| 31 Mar 2026 | £610,000 |
| 15 Jan 2008 | £495,000 |
No other historical records.
Flat 1, 8, The Square, Wimborne BH21 1JA
| Today | See what it's worth now |
| 30 Mar 2026 | £153,000 |
| 26 Feb 2018 | £140,000 |
23, Larch Wood Avenue, Wimborne BH21 2GE
| Today | See what it's worth now |
| 30 Mar 2026 | £573,000 |
| 28 Jun 2022 | £570,000 |
No other historical records.
9, De Haviland Close, Wimborne BH21 1XU
| Today | See what it's worth now |
| 27 Mar 2026 | £620,000 |
| 30 Jul 2004 | £375,000 |
4, Rugby Way, Wimborne BH21 2GJ
| Today | See what it's worth now |
| 27 Mar 2026 | £285,000 |
| 14 May 2021 | £260,000 |
No other historical records.
71, Hayes Lane, Wimborne BH21 2JD
| Today | See what it's worth now |
| 27 Mar 2026 | £625,000 |
| 18 Feb 2022 | £600,000 |
31, Rosamund Avenue, Wimborne BH21 1TE
| Today | See what it's worth now |
| 27 Mar 2026 | £398,300 |
| 23 May 1997 | £80,000 |
No other historical records.
10, Osborne Road, Wimborne BH21 1BL
| Today | See what it's worth now |
| 27 Mar 2026 | £415,000 |
| 1 Oct 2021 | £405,000 |
24, Cockerell Close, Wimborne BH21 1XT

| Today | See what it's worth now |
| 27 Mar 2026 | £390,000 |
| 3 Mar 2017 | £293,000 |
33, Egdon Drive, Wimborne BH21 1TY
| Today | See what it's worth now |
| 27 Mar 2026 | £470,000 |
| 23 Feb 2007 | £265,000 |
No other historical records.
23, Merley Park Road, Wimborne BH21 3DA
| Today | See what it's worth now |
| 26 Mar 2026 | £822,500 |
| 28 Sep 2022 | £800,000 |
10, Hayes Lane, Wimborne BH21 2JE
| Today | See what it's worth now |
| 26 Mar 2026 | £445,000 |
| 25 May 2011 | £310,000 |
36, De Haviland Close, Wimborne BH21 1XU

| Today | See what it's worth now |
| 25 Mar 2026 | £540,000 |
| 4 Mar 2013 | £271,000 |
No other historical records.
Grange House, Grange Farm - Access Road, Wimborne BH21 4HP
| Today | See what it's worth now |
| 23 Mar 2026 | £750,000 |
| 12 Mar 2019 | £700,000 |
No other historical records.
45, Oakley Hill, Wimborne BH21 1QQ

| Today | See what it's worth now |
| 23 Mar 2026 | £525,000 |
| 30 Apr 2019 | £540,000 |
19, Harness Close, Wimborne BH21 2UF
| Today | See what it's worth now |
| 20 Mar 2026 | £310,000 |
| 11 Dec 2020 | £277,500 |
109, Sopwith Crescent, Wimborne BH21 1SW
| Today | See what it's worth now |
| 20 Mar 2026 | £450,000 |
| 9 Jan 2004 | £229,200 |
No other historical records.
34, Canford View Drive, Wimborne BH21 2UW
| Today | See what it's worth now |
| 20 Mar 2026 | £465,000 |
| 11 Nov 2016 | £360,000 |
Source Acknowledgement: © Crown copyright. England and Wales house price data is publicly available information produced by the HM Land Registry.This material was last updated on 9 July 2026. It covers the period from 1 January 1995 to 30 April 2026 and contains property transactions which have been registered during that period. Contains HM Land Registry data © Crown copyright and database right 2026. This data is licensed under the Open Government Licence v3.0.
Disclaimer: Rightmove.co.uk provides this HM Land Registry data "as is". The burden for fitness of the data relies completely with the user and is provided for informational purposes only. No warranty, express or implied, is given relating to the accuracy of content of the HM Land Registry data and Rightmove does not accept any liability for error or omission. If you have found an error with the data or need further information please contact HM Land Registry.
Permitted Use: Viewers of this Information are granted permission to access this Crown copyright material and to download it onto electronic, magnetic, optical or similar storage media provided that such activities are for private research, study or in-house use only. Any other use of the material requires the formal written permission of Land Registry which can be requested from us, and is subject to an additional licence and associated charge.
Rightmove takes no liability for your use of, or reliance on, Rightmove's Instant Valuation due to the limitations of our tracking tool listed here. Use of this tool is taken entirely at your own risk. All rights reserved.